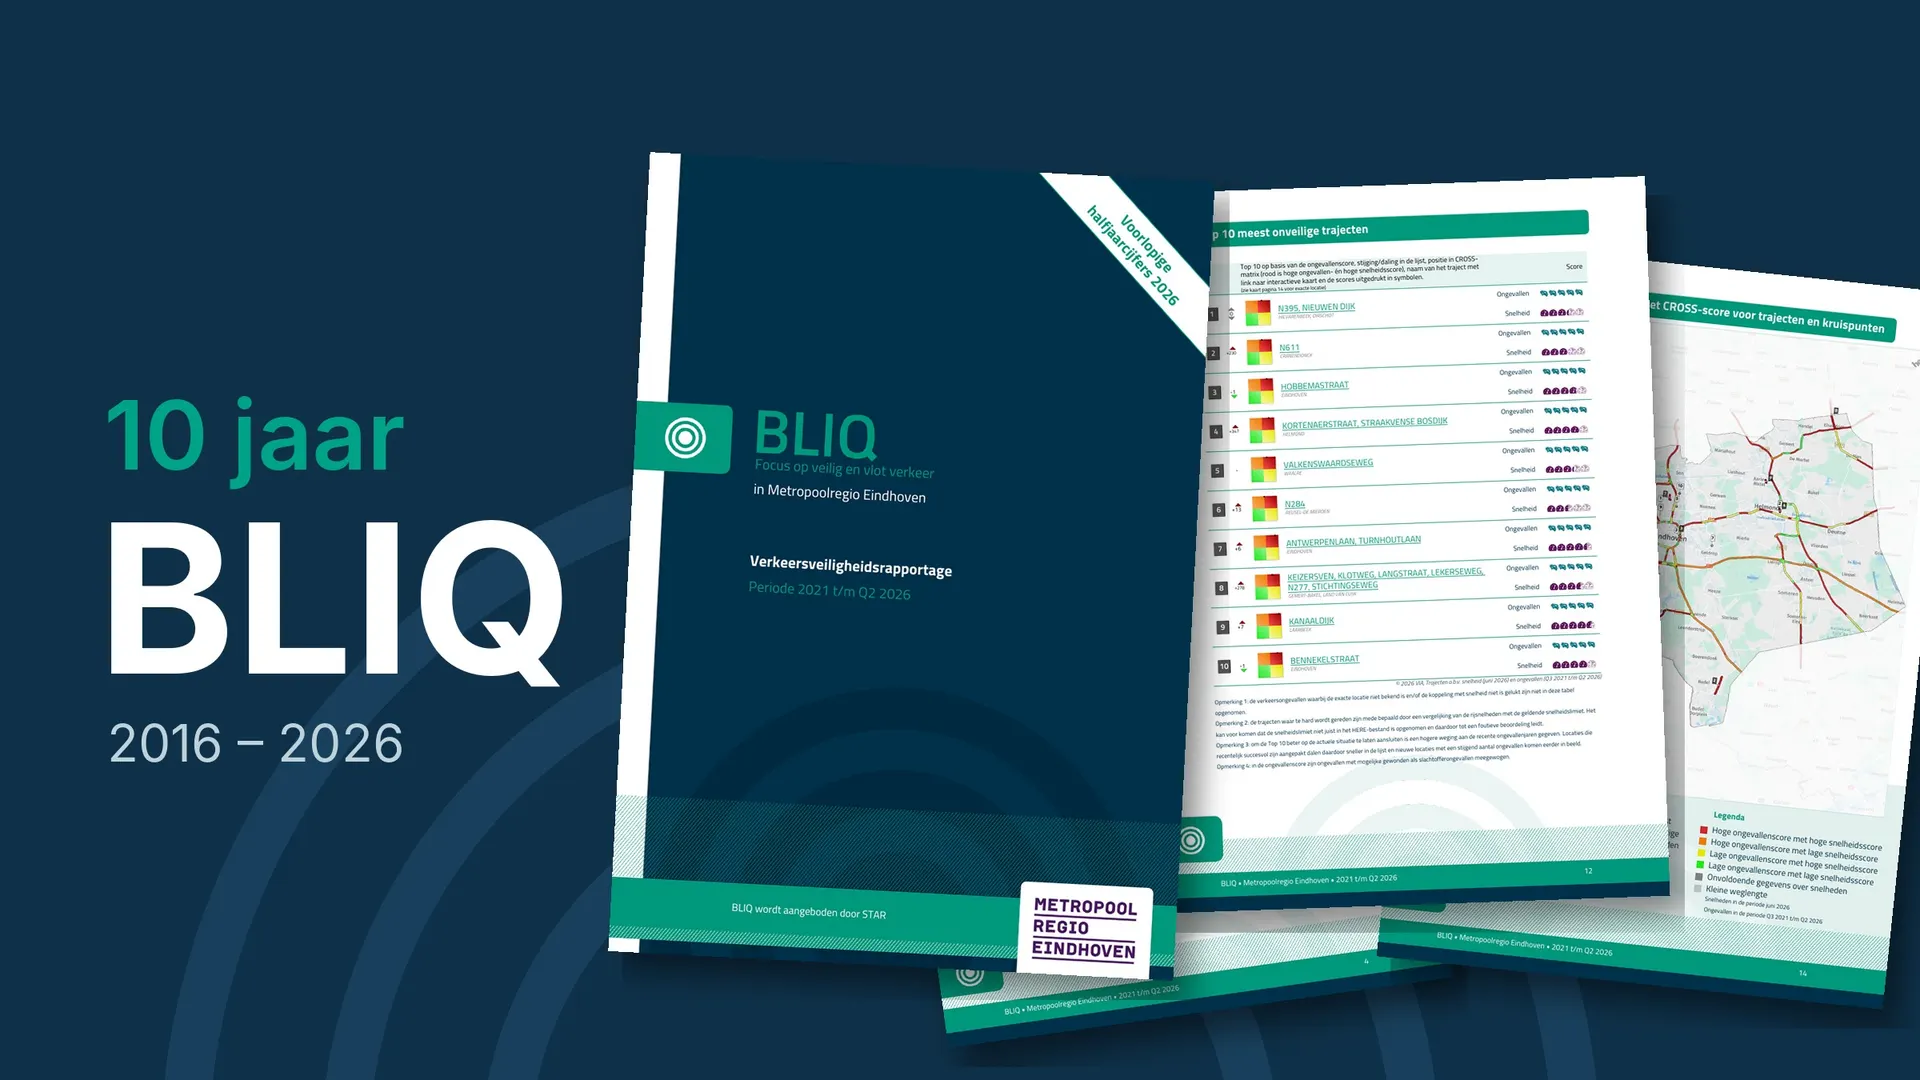
BLIQ is much more than an ordinary road safety report. Road authorities and the police download the ready-made report with one click. The report is immediately ready to be forwarded to, for example, the councillor or the city council. This serves the joint approach to road safety: everyone works from the same figures. The report is the perfect starting point to continue working in the software or to arrive at risk-based policy. That makes BLIQ a unique product, and it is spotlighted in this article.
Clear trend and areas of concern
BLIQ is a road safety report that shows the trend and the areas of concern per region. On behalf of STAR, the report is offered free of charge to road authorities and the police. BLIQ is primarily meant to be forwarded: to the councillor, the city council, the provincial council or colleagues. The content is therefore deliberately kept simple. To make the figures easy to interpret, it contains short texts, definitions and explanations. Anyone can download the current BLIQ reports from the VIA website.
Road safety on the agenda
You can download a BLIQ report for your own region, but also for a neighbouring municipality, a comparable region or the whole of the Netherlands. The report is published three times a year: in February, April and September. Its periodic publication helps to keep road safety on the political agenda. Each edition covers a different period and serves a different purpose.
February: provisional annual figures
This BLIQ contains the provisional annual figures for the past year and the final figures for the four years before. With a subscription to the collision signal function, the contents of this BLIQ come as no surprise to users of VIA Software: they can follow the developments day by day. It announces the final annual figures in advance. Used smartly, it lets you work on road safety proactively. Problems can be identified early and actions taken, such as a meeting with the police. Civil servants use this BLIQ to draft their policy memo. They forward it together with BLIQ in April, when the final figures are published.
April: final annual figures
At the end of March the STAR database closes and the annual figures become final. You can consult these annual figures in BLIQ or in the collision statistics. Ahead of the publication of the national figures (BRON), BLIQ already reports on the final annual figures in April. The BLIQ report is suitable for forwarding directly to politicians. If questions arise, the answers can be found in the software. This BLIQ serves as the basis for the discussions on next year’s budget. Because the reporting is unambiguous, everyone uses the same information and unnecessary discussion is avoided.
September: provisional half-year figures
The BLIQ of early September contains the final annual figures for the four most recent years and the provisional half-year figures for the current year. Users of VIA Software can also consult these figures in the collision signal function (with the right subscription). This BLIQ is ideal for an interim look at road safety for the councillor or the city council. It shows whether the municipality, province or region is on track and in which direction the figures are heading. You can respond to signals in time and adjust where necessary. This BLIQ is also a useful reminder when the budget is finalised.
Effortless work process
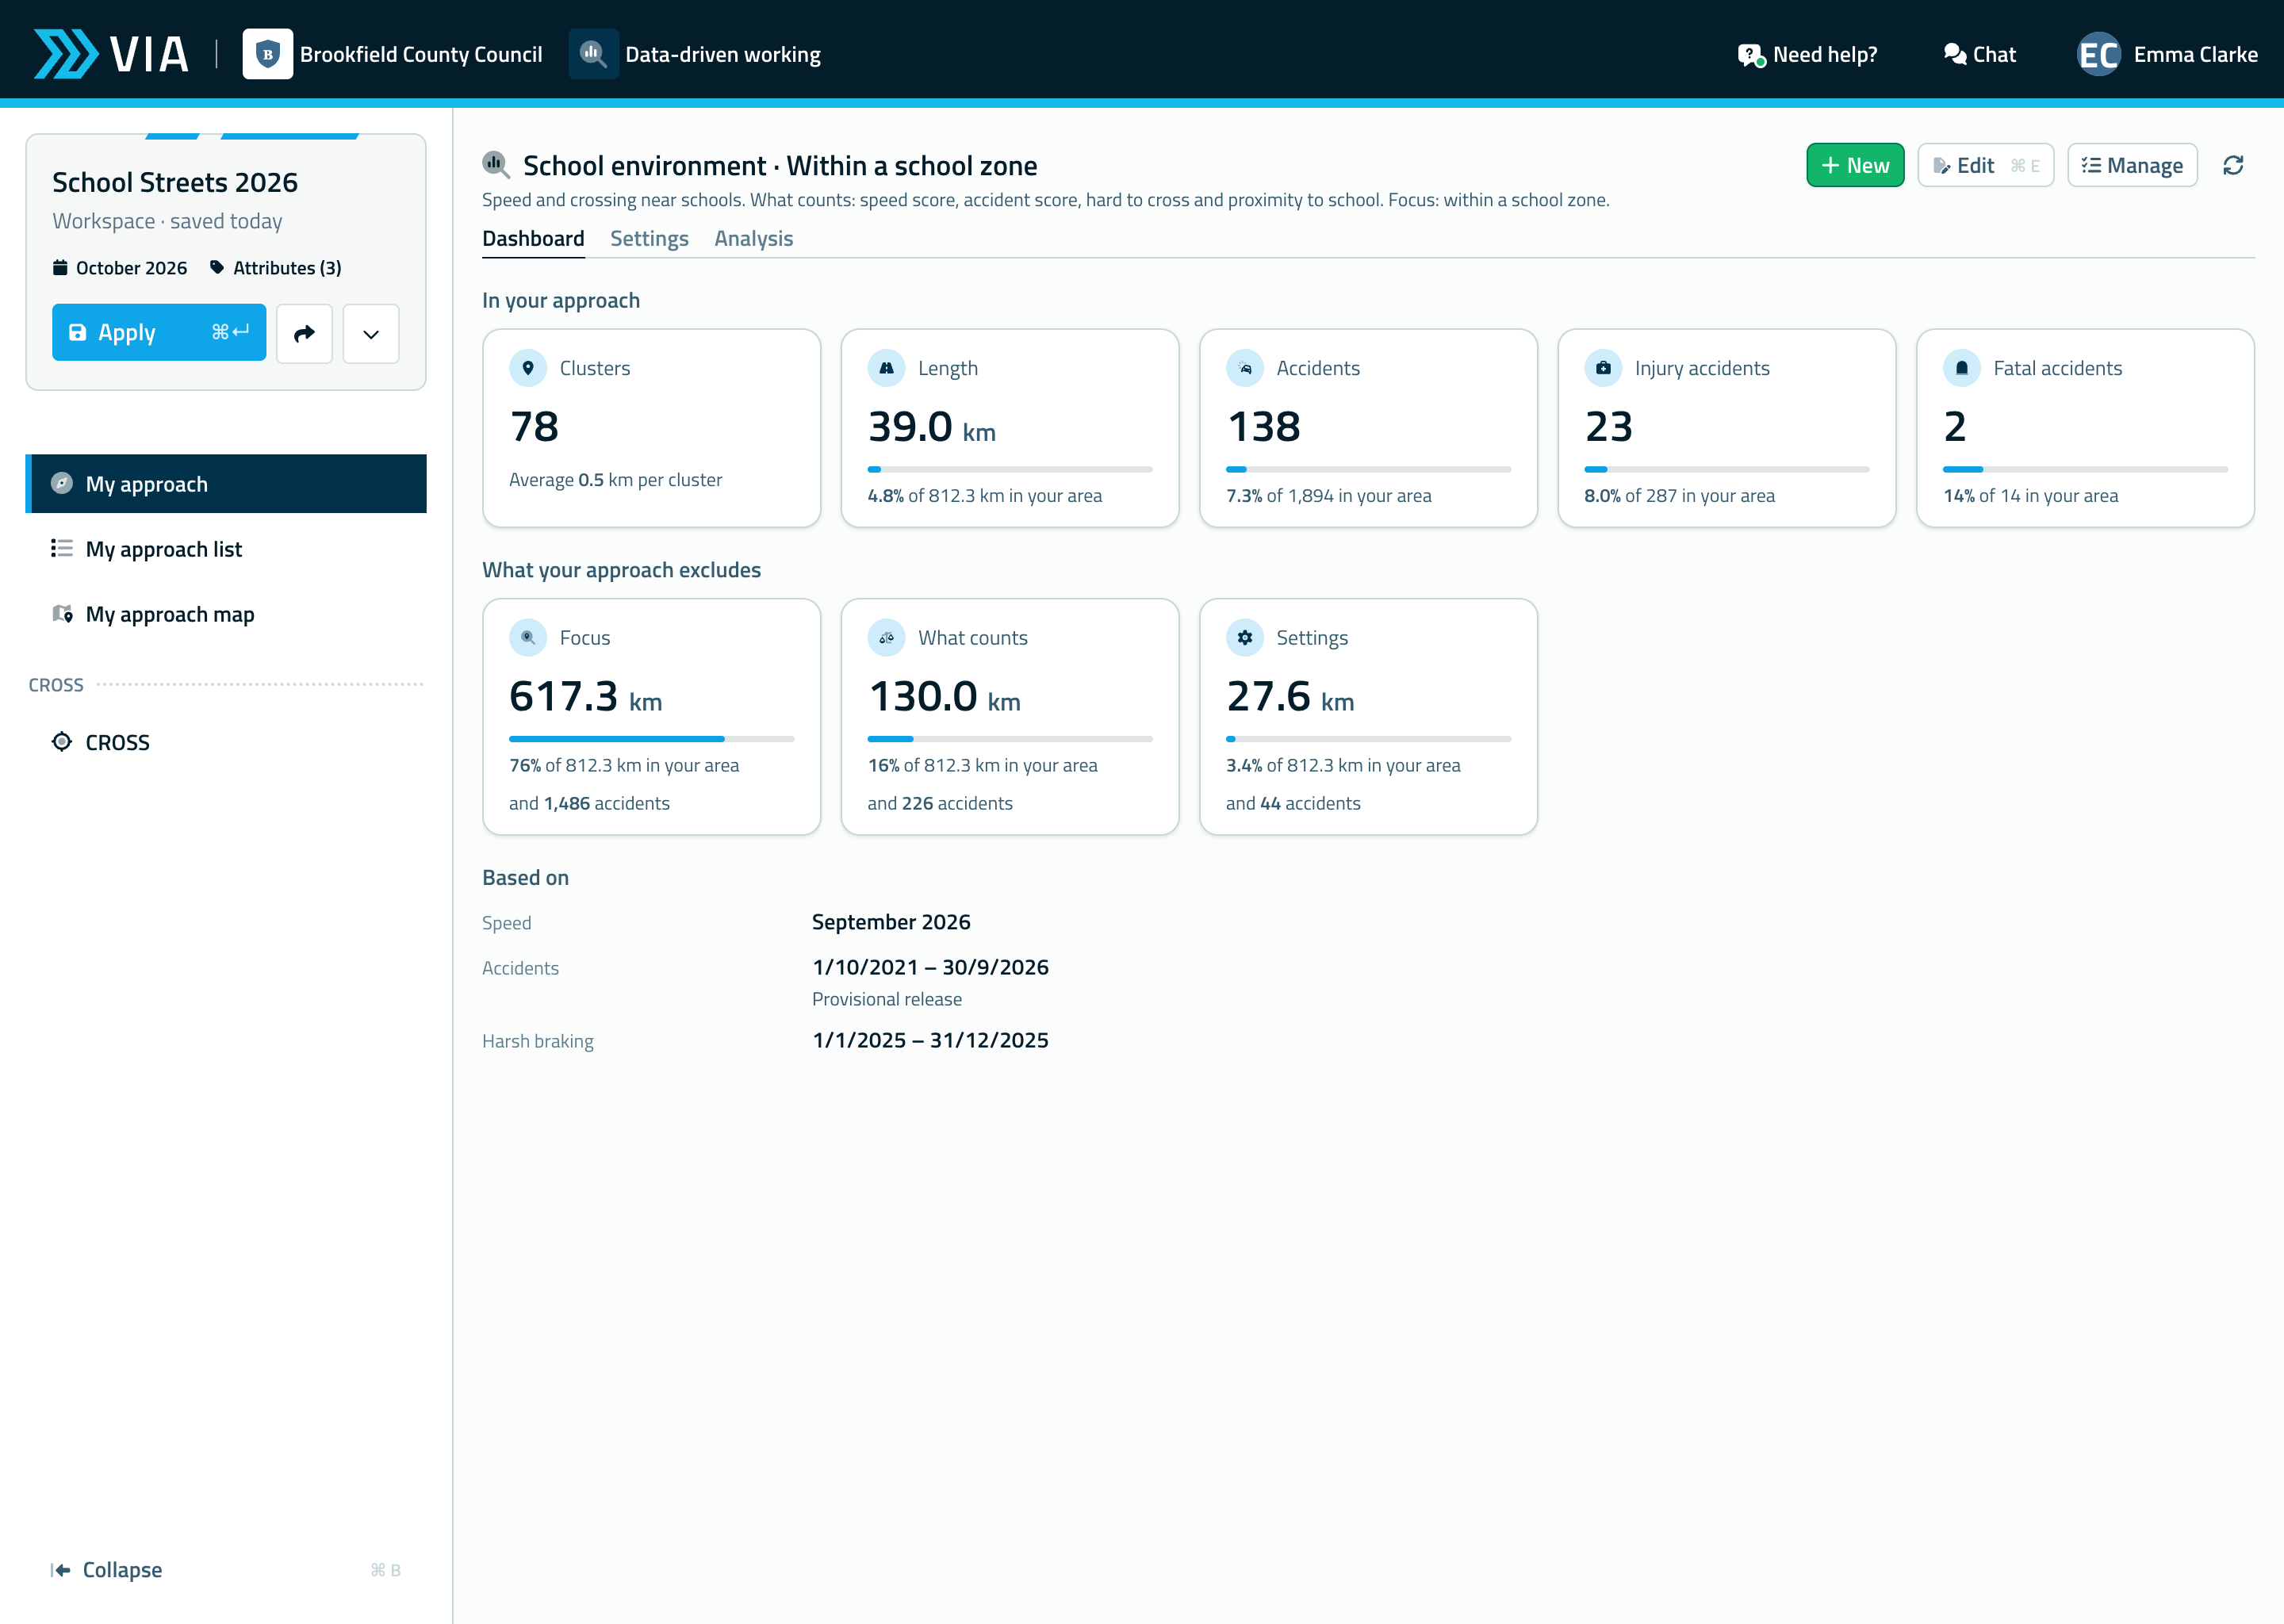
More and more users discover that the software connects seamlessly with BLIQ. BLIQ is the starting point for analyses and the software makes the follow-up possible. This supports a smooth and efficient work process. Below we highlight, chapter by chapter, how BLIQ carries through into the software.
Casualties and collisions
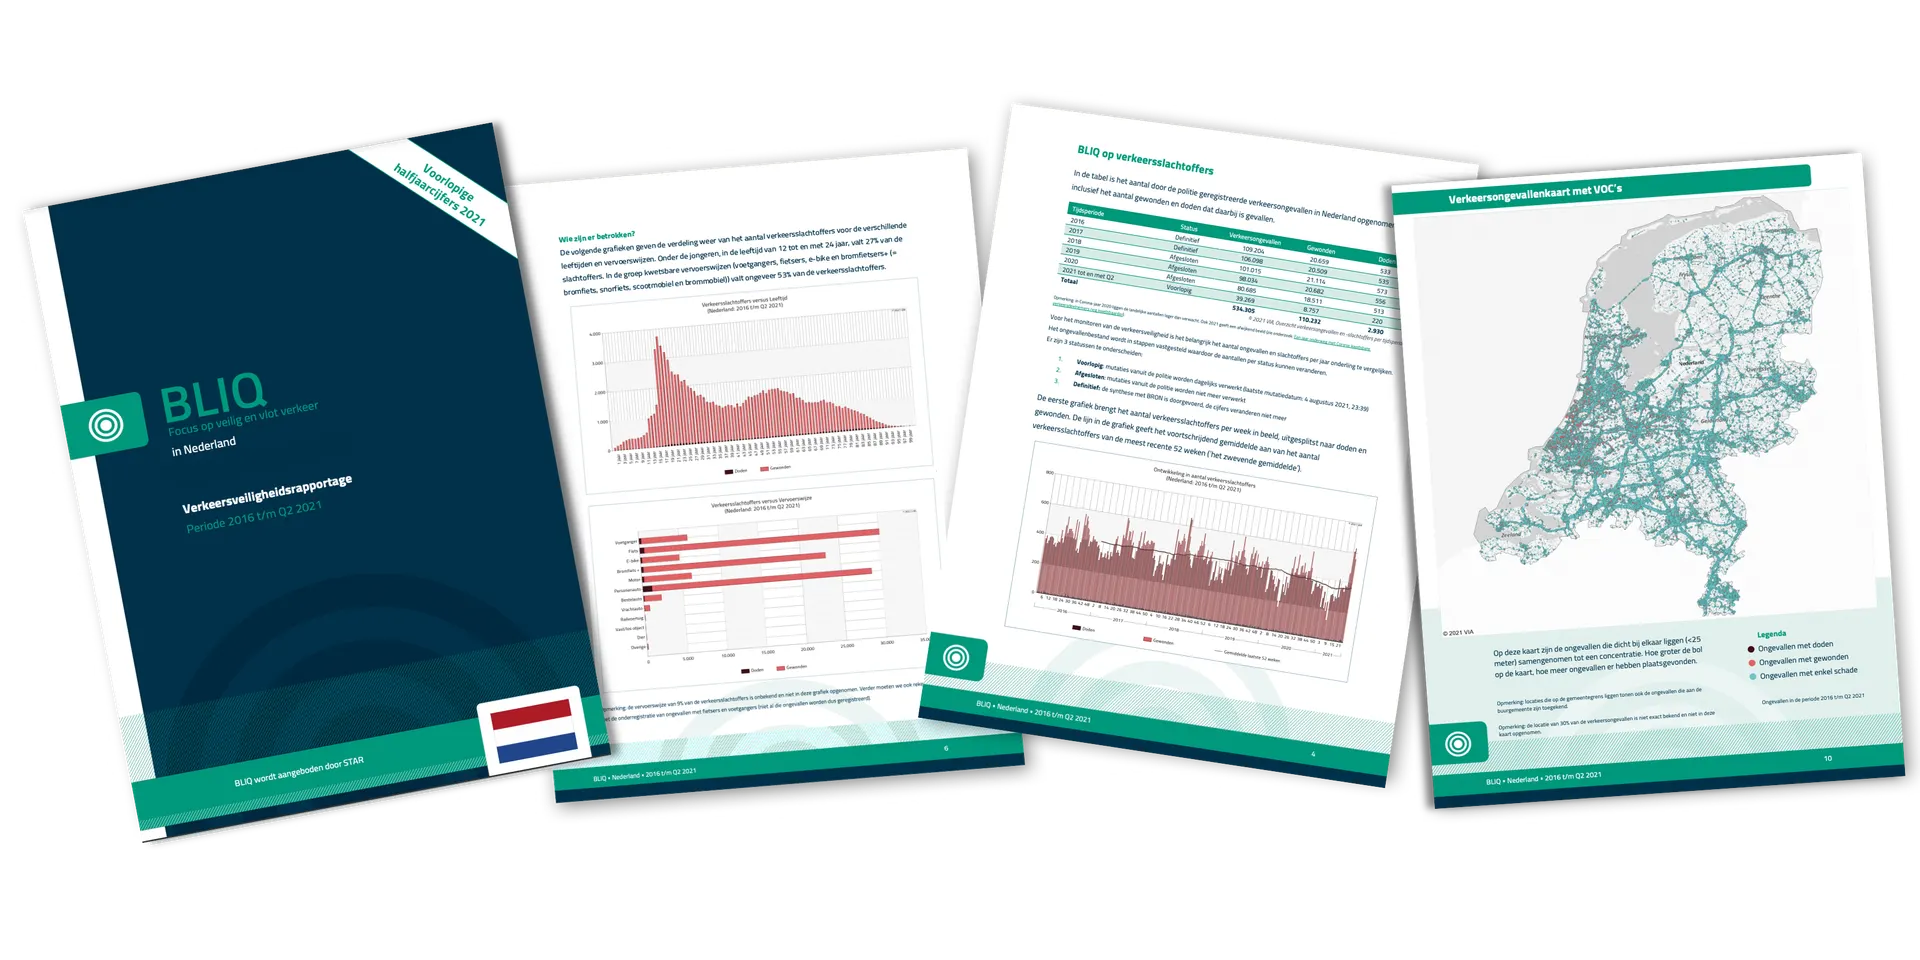
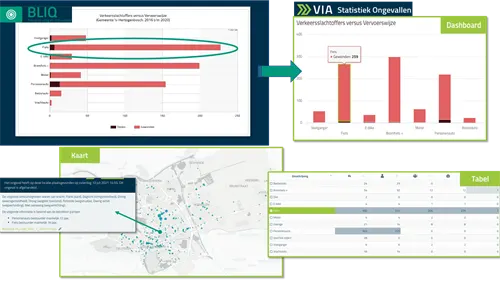
BLIQ works with collision data from the STAR database. The collision chapter contains four charts and a map of collision concentrations. The charts show the trend in the number of road casualties over several years, the target groups and the collision locations. In other words: who is involved, and when and where does it happen?
The four charts from BLIQ are also on the Dashboard in the software. The map of collision concentrations is under the Map tab. An area of concern from BLIQ is explored further in the software by choosing characteristics, filtering the data and analysing the details. With a subscription to the collision signal function, new collisions are added to the database every night. This makes it easy to monitor how the figures develop.
BLIQ on speeds
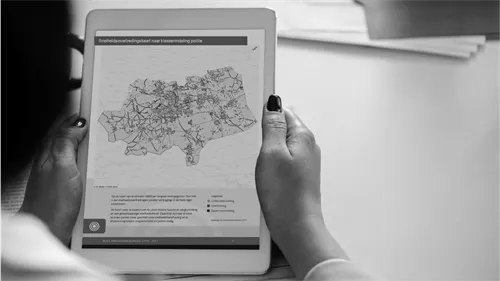
The speeds in BLIQ come from the Floating Car Data supplier HERE. Floating Car Data are anonymous speed measurements from vehicles in traffic. The speed chapter contains a chart of speeding per kilometre of road length for each speed limit and a speeding map divided into the classes the police use. The chart shows, for example, on how many kilometres of 50 km/h roads people drive too fast. The map shows where in the region there is a minor violation, a violation or a serious violation. These classes match those of the Dutch police.
The software contains the same map as BLIQ: the interactive map of speed limit violations based on the V85, the speed that 85% of vehicles do not exceed. There you can click on road sections, consult the details and analyse detailed charts (such as free flow, V85 with and without delay and the average speed).
Risk approach with CROSS
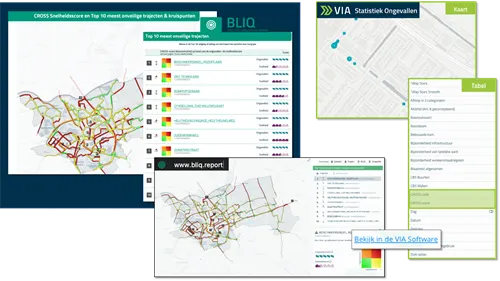
CROSS is a unique method developed by VIA. It is part of BLIQ because it is also a starting point for policy. CROSS crosses the collision score of a road section or intersection with an explanatory variable. In BLIQ that variable is the speed score. CROSS thus helps to answer the question: what could explain the high collision score? Does speed play a role? In this way BLIQ fits seamlessly into a risk-based approach to road safety.
The CROSS chapter in BLIQ contains two top 10 lists: the most unsafe road sections and the most unsafe intersections. The collision score determines the position in the top 10. The chapter also contains the CROSS speed map, on which road sections and intersections get a colour code. That code is based on crossing the collision score with the speed score. The locations in the top 10 are interactive: click on one and you arrive at the public CROSS speed map (freely accessible to everyone), zoomed in on that location.
We are curious about your experiences with BLIQ! Let us know through our helpdesk chat. Are you a road authority or do you work for the police, and do you not have a personal VIA account to download BLIQ yet? Send an e-mail to info@via.nl and we will help you.