Henk Stipdonk[1] & Erik Donkers[2]
Abstract
Road traffic collisions claim around 1.2 million lives world-wide each year and many more serious injuries. The Safe System Approach is widely recognized as the key strategy to reduce this toll. It is grounded in scientific research, focussing on all pillars of the traffic system, adhering to the core principles of Safe System thinking and acknowledging the primary responsibility of professionals to ensure that every road user can return home safely after each journey.
However, putting the Safe System Approach into practice to improve road safety is easier said than done. It is a broad, overarching framework that does not automatically account for local specifics or the unique constraints of individual teams of road safety professionals. As a result, local decision-makers still face practical questions: Where should improvements start? Which interventions will have the most impact? Worldwide, many policymakers - at national, regional or local levels - struggle to determine the most effective ways to enhance road safety with limited resources.
This is where CROSS can help.
CROSS is a decision-support tool for road safety policymakers, road authorities and enforcement officers. It uses data from road networks and traffic activity to inform policy. Road network characteristics include many elements, CROSS only uses the speed limits, segment length and road function. Traffic data include traffic volume, vehicle speeds and collision statistics. These data help identify and prioritize road safety interventions. With CROSS, policymakers can pinpoint road segments or junctions with high collision frequencies or elevated risks and assess whether these are related to excessive speed.
The road network, traffic and speed data used by CROSS are based on information from HERE, a global traffic data provider. Collision data stem from police records, such as those maintained in the Netherlands, Germany, United Kingdom or Chile. CROSS integrates these datasets and presents combined insights to policymakers. It highlights roads or junctions that, based on road category, collision frequency (i.e. collisions per year), collision risk (collisions per distance travelled) and speeding behaviour, should be prioritized for interventions.
This paper demonstrates how CROSS collects and presents its data, evaluates the reliability and practical relevance of its analyses for policymaking and explains the current formats used for data visualization. The current version of CROSS is the first operational release. Its quality and functionality will continue to evolve as new data become available and user feedback is incorporated.
1. Introduction
The World Health Organisation estimates that 1.19 million lives were lost on the roads world-wide, with many more serious injuries [1]. The Safe System Approach [2] is widely recognized as the key strategy to reduce this toll. This approach is grounded in scientific research and focuses on all pillars of the traffic system, i.e. road safety management, roads, vehicles, behaviour, speed and post-crash care. Further, the five key components of Safe System thinking are addressed: robust institutional governance, share responsibility, strengthen all pillars, prevent exposure to large forces and support safe road user behaviour. According to this approach, it is primarily the responsibility of professionals to ensure that every road user can return home safely after each journey.
However, putting the Safe System Approach into practice to improve road safety is easier said than done. It is a broad, overarching framework that does not automatically account for local specifics or the unique constraints of individual teams of road safety professionals. As such, it cannot take into account the options and limitations that arise from the everyday practice of road safety policy making and local constraints. As a result, local decision-makers still face practical questions: Where should improvements start? Which interventions will have the most impact? Worldwide, many policymakers—at national, regional or local levels—struggle to determine the most effective ways to enhance road safety [4…6]. Usually, data analysis knowledge or access to technical tools to match collision data to traffic data are limited [7,8]. Therefore, to decide which roads, junctions or types of road users to prioritize is a challenge. To decide which interventions will be most effective, how limited resources can be allocated wisely, are both urgent and strategical questions.
Road safety policy making usually aims for long term progress, as improving road safety in general is not a short-term process, although the choice can be a dilemma, e.g. [9]. Roads, built for undisturbed and massive traffic without accommodating the pedestrians that need to cross these roads to go to school, are not easily redesigned e.g. [10]. Setting up institutions for road collision data collection systems, or to provide research, to set up regular technical tests for vehicles, to see to proper driver training and exams, these are all not created overnight. While long term focus is crucial, politicians also need to find ways to improve safety today, e.g. by focusing on hot spots where collisions are many or speeds are higher than they should be. A mere collision database gives limited insight to help decide where to start with interventions, e.g. [11]. Road collision data may be suffering from underreporting (especially in rural areas). This was shown for road deaths in European countries [12]; there is evidence this is much worse for less severe collisions in the EU or elsewhere. For the available collision data, it is not always known to what extent collisions can be (statistically) attributed to road geometry, vehicle speeds or traffic volume.
For road safety policy making, road authorities and enforcement officers, insight into these data isn’t easily achieved. Often, data describing traffic volumes (if available at all) combined with traffic speeds (if available at all), road layout data and collision data are scarce, e.g. if traffic data are based on roadside traffic observations or induction loops. However, for a good understanding of road safety issues, this combination is essential, e.g. [13]. It is with this in mind that we designed a practical tool, CROSS, which literally crosses collision data with speed and traffic volume data by location. This allows the road safety policy maker to literally look at these visualized data in an easily accessible GIS-environment.
2. The practical challenges
Consider a road safety policymaker, whether working for a district, a municipality, a province, a state or a national ministry, who wants to improve road safety. She is likely to aim for a reduction in the future annual number of road deaths, road injuries or road collisions in general. Usually this requires a long-term road safety action plan, addressing different aspects of the road safety policy. For example, enforcement could be involved, or speed management, or safer road design, or stricter vehicle safety rules, regulations and inspections. Or even better, the improvement of road safety management in general, addressing research, education of professionals, etcetera, all according to the Safe System approach.
The policymaker and her team will need to have access to road collision data, travel data, speed data, road network data and perhaps other data such as Key Safety Performance Indicators. Analysis of these data could reveal focal points for action. However, these data are not always available, and if they are, the massive volume of these data may form a problem for the analysts. It may be difficult to find the best way to navigate through the data or to present easy-to-understand visuals that show the essential findings leading the way towards decisions and interventions. These policy makers may themselves not be trained as expert data analysts or as road safety experts. Hence, to allow policy makers to decide where and how to intervene in traffic to make roads safer, the relevant data must be frequently (e.g. several times per year) collected, analysed and combined into visual information that gives a straightforward view on problems and solutions.
3. General method
This is how CROSS was designed. It uses data from road networks and traffic activity to inform policy. The road network consists of links and junctions. Road network characteristics include elements such as junction lay-out and link length. Traffic data include traffic volume estimates, vehicle speeds and collision statistics, all on a local level, i.e. for every road link. These data help identify and prioritize road safety interventions. With CROSS, policymakers can pinpoint road sections and junctions with either high collision frequencies or elevated risks (or both) and assess whether these are related to excessive motor vehicle speed.
The road network, traffic and speed data used by CROSS are based on information from HERE, a global traffic data provider [3]. Collision data stem from police records, such as those maintained in the Netherlands, Germany, United Kingdom or Chile. CROSS integrates these datasets and presents combined insights to policymakers. It highlights roads or junctions that could be good candidates for interventions. The selection is based on collision frequency (e.g., collisions per year), collision risk (e.g., collisions per distance travelled) and speeding behaviour, should be prioritized for action.
This paper demonstrates how CROSS presents its data, evaluates the reliability and practical relevance of its analyses for policymaking and explains the current formats used for data visualization. The current version of CROSS is the first operational release. Its quality and functionality will continue to evolve as new data become available and user feedback is incorporated.
4. Data
CROSS uses an integrated GIS-based set of data. The core of these data are the HERE network data [3]. HERE collects these data since 2018 from more than 170 providers. The data can stem from GPS-data of trips by connected vehicles, navigation systems, fleet telematics systems or mobile devices. The traffic data are available on a time-, date- and location level. The data cannot be related to the owners or the users of the vehicles. Their data are not modelled, but provided as is, except for obvious speed errors caused by obvious GPS errors. HERE further distinguishes passenger cars and trucks; CROSS uses passenger car data and truck data combined. In 2024, the HERE data covered traffic in 60 countries, on four continents. All data refer to the network GIS data. CROSS uses and offers the following data, the properties of which necessarily coincide with the data qualifications of police collision reports and HERE traffic and network data, combined with some choices made in CROSS.
A: Road collision data, provided they include the location description, denoting the link of the road or the location of the junction. These data are based on police collision reports and subsequently are as accurate, detailed and complete as their reports. Collision reports lacking an accurate location are left out. Road collision data quality and availability is country specific. CROSS is capable of integrating any structure of road collision data. Currently, collision data from The Netherlands, United Kingdom, Chile and part of Germany are available.
B: HERE road trip data, consisting of road network data (GIS) speed data and traffic volume data. CROSS considers the set of vehicles using the HERE navigation software, to which we will refer to as the HERE set, as a statistical sample of the set of all vehicles. The data sample based on the HERE set is not exactly a random selection of all vehicles, but on the other hand the HERE set is very large and increasing at a steady pace [See Appendix A]. Still, there may be a bias towards speeds and trips of new vehicles or to trips of people using a mobile device. HERE does not monitor or report the sample penetration, or proportion of moving vehicles which supply data. From a straightforward comparison between HERE data and motorway data made in the Netherlands [14], by the end of 2024, the HERE set amounts to approximately 25% of the total car fleet [See Appendix B for this comparison]. The comparison shows there are regional differences in the proportion of vehicles represented by HERE data: this proportion ranges from 21% to 31%.
Below, we will briefly describe how HERE data are used in CROSS. The description is based on the developers guide available at the HERE website [3].
B1 Road network data: These data can be used to identify properties of the elements (links and junctions) of the road network. HERE derives five different road functions based on traffic volume, speed limits and travel movements between major metropolitan areas, cities, neighbourhoods and local traffic. The four highest road functions form the main, contiguous road network used by CROSS. CROSS does not distinguish between the four road functions. The lowest road function, which is not currently included in CROSS, concerns roads for local traffic within and outside built-up areas, walkways, truck-only roads, bus-only roads, emergency vehicle-only roads, residential streets and dead-end roads.
The CROSS network distinguishes route sections and junctions. The junctions are divided into two types: 1) main junctions (junctions of the main road network) and 2) intermediate junctions (junctions with side streets of the main road network). The main road network is divided into route sections, i.e. a connection between two main junctions. The route sections will have a uniform road function and generally the same road design and traffic volume. If the speed limit of a route section changes (for example, when crossing a built-up area), the route section is split up.
Route sections and junctions (both main and intermediate) are both assessed as two separate categories within CROSS. For the road safety assessment of the route section, collisions at intermediate junctions are included, as these are part of the route.
B2 speed data: HERE calculate average vehicle speeds for 5-minute intervals (epochs) for every vehicle that drove on or through a road section in a specific direction, during these 5 minutes. Speeds are based on vehicle location (GPS) data, which, for each vehicle, are made available by the providers. Between providers, sample frequencies vary, and HERE averages these data such that every vehicle has the same weight, irrespective of the speed data frequency supplied by each provider. HERE makes these speed data available for 5, 15 or 60-minute epochs. CROSS uses 15-minute epochs for practical reasons, e.g. to reduce the amount of data with zero vehicles.
From these data, speeds and speed distributions can be derived for each link, and speeds can be compared to the local speed limits. From these data, several speed related properties can be derived, such as the V85, the number of speed observations exceeding the speed limit and other parameters. It is difficult to know or even estimate whether, or to what extent the speed distributions of the HERE vehicles represent the speed distribution of all vehicles or if systematic errors occur. We aim to do further research on the representativity of the HERE set for speed observations, while in the meantime, since the HERE set is increasing by approximately 5% of the total fleet annually, hence any bias is expected to gradually disappear in the future.
Naturally, speed averages are subject to statistical uncertainties: longer road sections, and higher vehicle counts allow for more accurate speed averages. HERE provides an accuracy measure based on the Z-statistic.
B3 traffic volume data: CROSS interprets the trips of the HERE set vehicles as a sample of all traffic. CROSS uses HERE’s vehicle counts to estimate distance travelled data based on 15-minute epochs of HERE data. Now, HERE presents vehicle counts for each road section for 5 and 15-minute epochs, based on the vehicles present on this road section during these 5 minutes. Estimating distance travelled for the entire road section from these counts is straightforward, by multiplication of link lengths and traffic counts. However, a slight over-estimation of the actual traffic volume values arises. When calculating distance travelled from vehicle counts and link lengths, all vehicles that were present on the road section are supposed to have travelled the entire section. This assumption, however, is not entirely correct, as some of these vehicles may have started travelling this road section after the 5-minute epoch started, or were still present on the road section at the end of the 5m epoch. Hence not all vehicles travelled the entire road length. By collecting 15-minute data from HERE, this effect is also present. We have not researched the exact size of these effects, but a slight overestimation of distance travelled may be expected, especially at very low vehicle counts or long links. This overrepresentation will in general depend on the (average) length of links, and the average speed.
5. Functionality of CROSS
In CROSS, collision data, network data, speed data and travel data are combined to reveal locations that may need attention from policy makers and require interventions. This is done along the following steps:
- a. Road links and junctions are categorized, so as to provide a reference for comparing traffic and collision data.
- b. All data are represented as properties of road sections or junctions.
- c. The results are shown as a list and in a map of the region of interest.
- a. Based on properties of road links, all road sections are categorized based on traffic data, geometrical properties and properties (and traffic data) of road sections that are linked to the road section or junction.
- b. Collision data, speed data and travel data are combined for each road section and junction. Collision data are usually located at a point on the map, whereas speed and travel data refer to a link with a certain length.
- c. Representations were developed to allow actors, e.g. policy makers, researchers and police officers to interpret the data such that options for policy interventions can be listed. This enhances cooperation between different relevant actors, as they make use of the same data sets and representations. These representations are based on mutual comparison, i.e. roads with higher speeds as compared to V85 or higher-than-average collision frequencies are distinguished from roads with lower speed- or collision frequency values.
6. How CROSS uses collision data and speed data for its users
Collision score
The Collision score is based on the following four indicators:
- number of collisions in the last 60 months
- number of collisions with casualty (injury or killed) in the last 60 months
- number of fatal collisions in the last 60 months
- casualty collision risk in the last 12 months (number of casualty collisions divided by vehicle distance travelled, based on HERE FCD).
For each of these indicators, all road sections are ranked between 0 and 1. The road section with the highest value for an indicator, receives the ranking value 1. For every road section, this results in ranking values for each of these four indicators. The average of these ranking values is used as the Collision score in CROSS. [See Appendix C for a more detailed explanation of the Collision score calculation]
Speed score
The Speed score is based on the following indicators:
- The excess speed (if any) of V85 as compared to the speed limit
- The proportion of vehicles with a speed above the speed limit
- The traffic volume
The set of roads and junctions with a V85 below the speed limit receives a Speed score based on indicators 2 and 3. For the set of roads and junctions with a V85 above the speed limit, all three indicators are used. The Speed score is then obtained by averaging these three indicators, where the traffic volume is first divided by 3, to prevent motorways to dominate the overall ranking. In effect, traffic volume receives a three times lower weight than the other two indicators.
Subsequently, the resulting values for all national sections are ranked between 0 and 1. Further explanation is given in Appendix C.
CROSS score
The CROSS score is the two-dimensional combination of the Collision score and the Speed score. It is used in an important visual, the CROSS matrix, described below.
7. Visuals presented to CROSS users
In this section we show how CROSS users proceed to select their region of interest, and how they can observe roads of interest for road safety policy or speed control.
- Selection of region of interest
- Presentation of maps
- Presentation of lists of roads with high collision- or speed values (top ten)
- Presentation of CROSS-matrix with Collision score and Speed score
CROSS is currently available for the Netherlands, the United Kingdom, Chile and parts of Germany. The examples below illustrate step-by-step how users can use CROSS in their work.
Working with CROSS
CROSS’s important target group also includes smaller organizations within municipalities and police forces where expertise in data integration and GIS applications isn’t necessarily available.
CROSS is a Software as a Service (SaaS) solution that requires only a computer with internet access. Regular data updates (three times a year) and software upgrades are performed automatically. CROSS is easy and accessible to use.
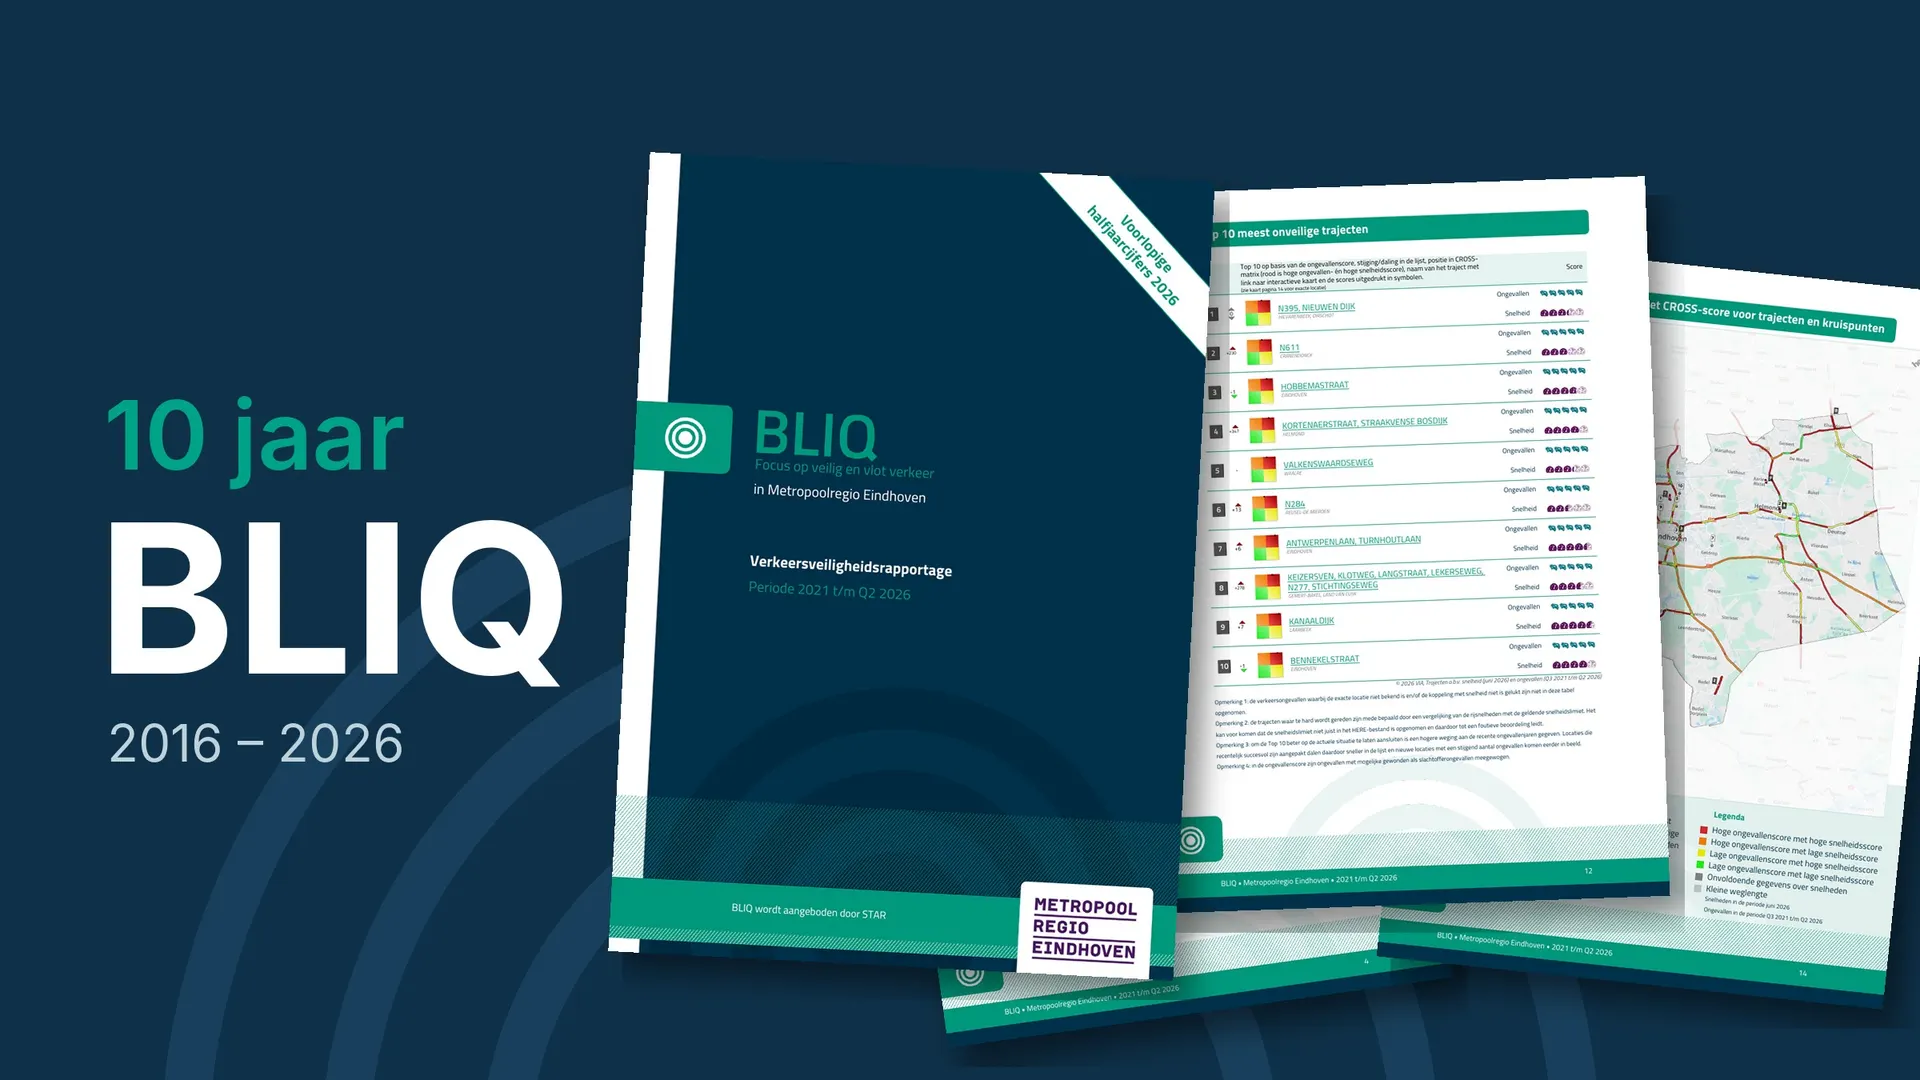
CROSS automatically generates a road safety report for policymakers and politicians based on collision data, speed data and CROSS results for each target area. This is called a BLIQ-report. [See the ‘Traffic Safety Report (BLIQ)’ section in the VIA Library for examples of BLIQ: https://www.via.nl/en-GB/Downloads]
The user can use CROSS in three ways:
- Using the Home page in the VIA Software (a login account is required)
- Directly to the URL: https://bliq.via.software (no login account required, Speed score indicators are not visible on the public map)
- By clicking on the street name of a route section or junction in the Top 10 lists as included in the BLIQ report.
The same version of CROSS is used for all countries where CROSS is available. Using icons at the top of the menu bar, the user can switch between target areas (national, province/region, municipalities or police zone), access information about using CROSS, including brief instructions, and switch between different countries and available languages. Switching between countries and target areas allows for benchmarking between cities of similar size, for example.
CROSS offers all available functions on a single screen. Users can choose from all target areas, allowing them to view neighbouring municipalities, for example, if a route runs from one municipality to another, or to benchmark against similar municipalities.
After selecting a target area, the map and the Top 10 list automatically update. The priority of the Top 10 is determined by the Collision Score. Thanks to the ranking methodology, each target area has a specific Top 10 of route sections and junctions. Users can click on the Top 10 numbers on the map or in the Top lists to access detailed information.
Zooming in on the map reveals more detailed information: the entire main road network, the division into route sections and junctions, and their colour scheme based on the point’s location in the CROSS matrix. The location is determined by the vertical Collision Score axis and the horizontal Speed score axis. The CROSS matrix consists of four squares, each with its own definition, allowing for searches focused on different relevant situations:
- Bottom left: green, low Collision score and low Speed score
- Bottom right: yellow, low Collision score and high Speed score
- Top left: orange, high Collision score and low Speed score
- Top right: red, high Collision score and high Speed score
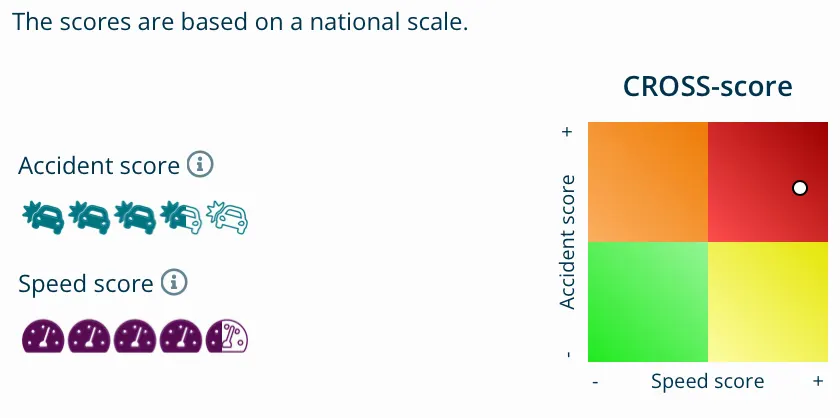
A quick overview of the results can be obtained by moving the mouse over the various route sections and junctions. If the location is correct, the CROSS score can be viewed in the matrix in the right sidebar, including the ranking of the Collision and Speed scores based on the filling of the two symbols used.
For more detailed insight into the indicators used to determine the Collision and Speed scores, users can click on a location with the mouse. The location is then selected, and users can click on the Collision or Speed score next to the matrix to view the detailed values of the indicators.
If one chooses to further investigate a route section or junction, various download options are available: the map of the target area, the location, the BLIQ report of the target area and the Shape file for further processing the data in GIS. Using the CROSS code number (at the bottom of the sidebar), detailed analyses of the collision data can be performed in VIA Software. A detailed route report of the route section can also be generated.
Use of CROSS
To get an idea of whether and how CROSS is used in practice, a simple internet search for reports that include CROSS was conducted. Below is an overview of current examples from municipalities and police districts in the Netherlands. These indicate that CROSS is used for risk analyses, road safety research, strategic road safety plans, municipal council information and road safety implementation agendas [See appendix D].
Visuals of the CROSS tool
Below is an explanation of the visuals used in CROSS.
The CROSS matrix shows a combination of the Collision score and the Speed score in a two-dimensional visual, with four quadrants, based on low/high Collision scores and low/high Speed scores. Each quadrant is coloured. Within each quadrant light and dark tones illustrate higher or lower values of the two scores. Points in the matrix are coloured darker when further away from the centre of the matrix. Each road section and each junction can be presented as a dot in this matrix. The colour of the dot is used in other visuals. See Figure 1.
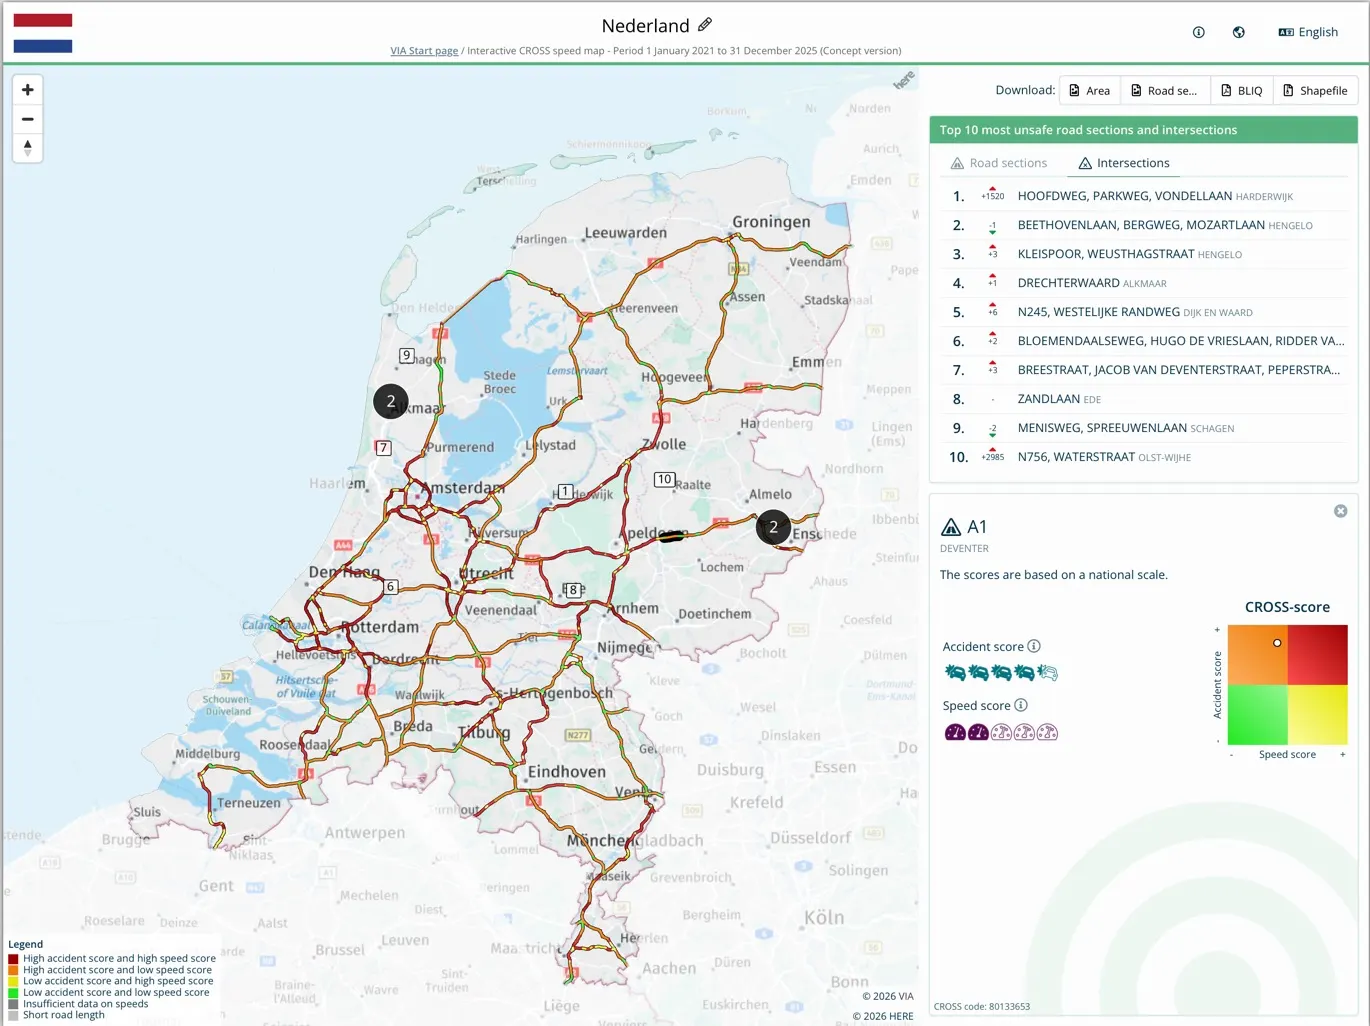
Lay-out of the general CROSS map, with road sections and junctions, in the colour of the dot in the CROSS matrix. Depending on the map’s scale, the main road network is displayed. In this example, the map of the Netherlands with the A-roads. Zooming in further reveals a denser road network. The Top 10 (top sidebar) shows the 10 road sections or junctions with the highest Collision Score in the selected target area, in this example, the Netherlands. The position shift in the Top 10, relative to the previous position, is also included. Clicking on the street names automatically zooms in on the map, and the CROSS score is visualized in the bottom right corner. See Figure 2.
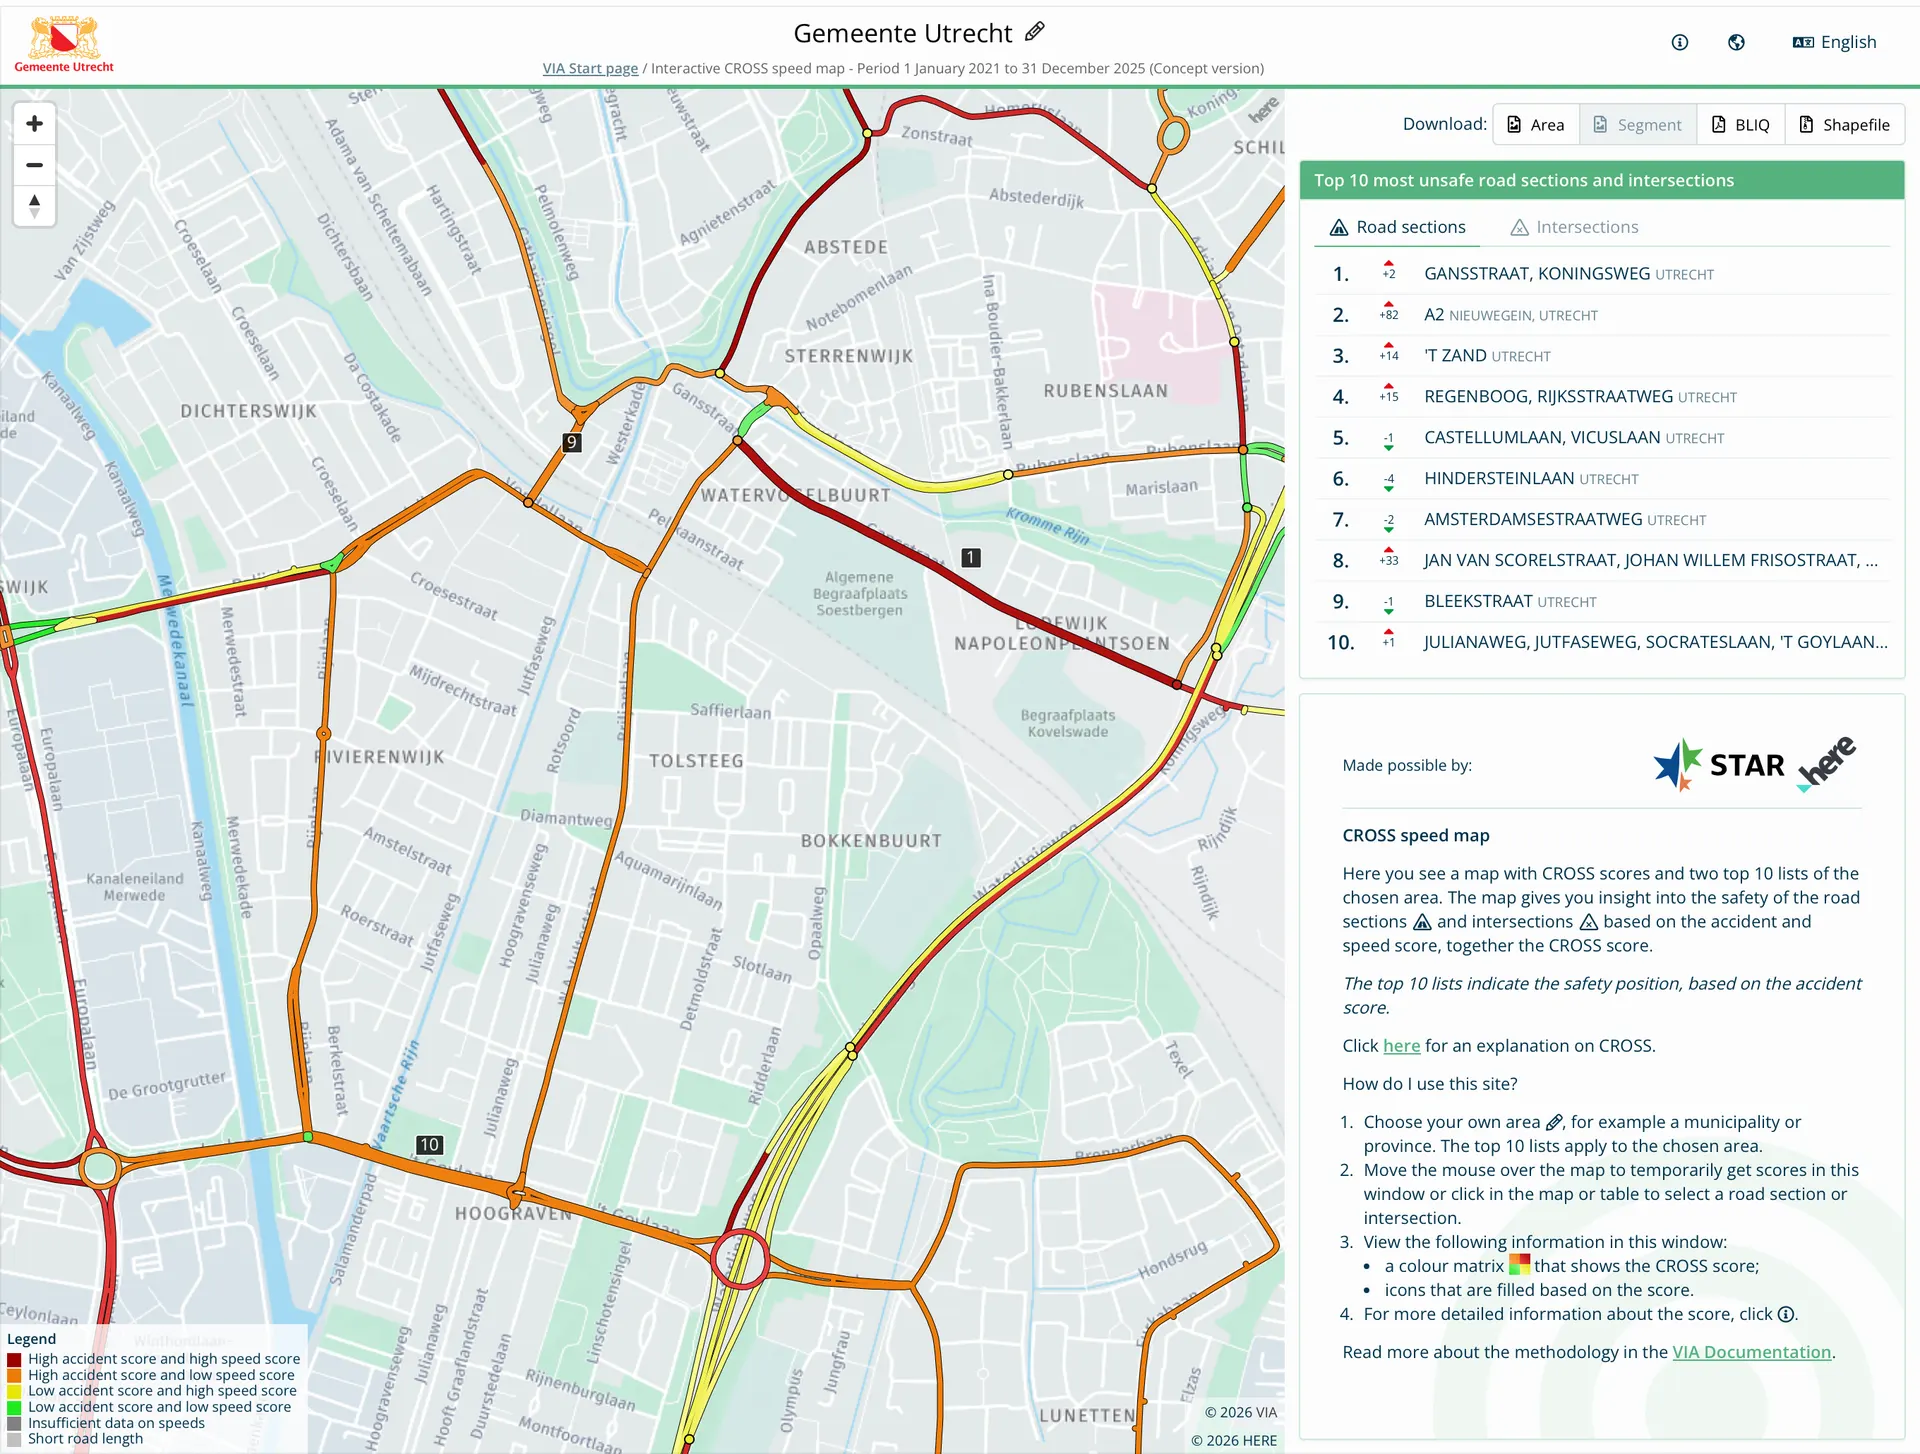
Selecting a target area in CROSS, at the top of the menu bar, aligns with the various target groups: provinces/regions, municipalities and police zones. By selecting a target area, i.e., the municipality of Utrecht, the map zooms in on the chosen area. The smaller scale of the map makes more roads visible. The colour of the road sections and junctions is based on the national ranking, the position of the dot in the CROSS matrix. However, the TOP 10 of road sections and junctions is specific to the selected target area, i.e., the municipality of Utrecht. This approach ensures that each target area has a priority of road sections and junctions indicated by numbers 1 through 10 on the map and in the TOP 10 list. See Figure 3.
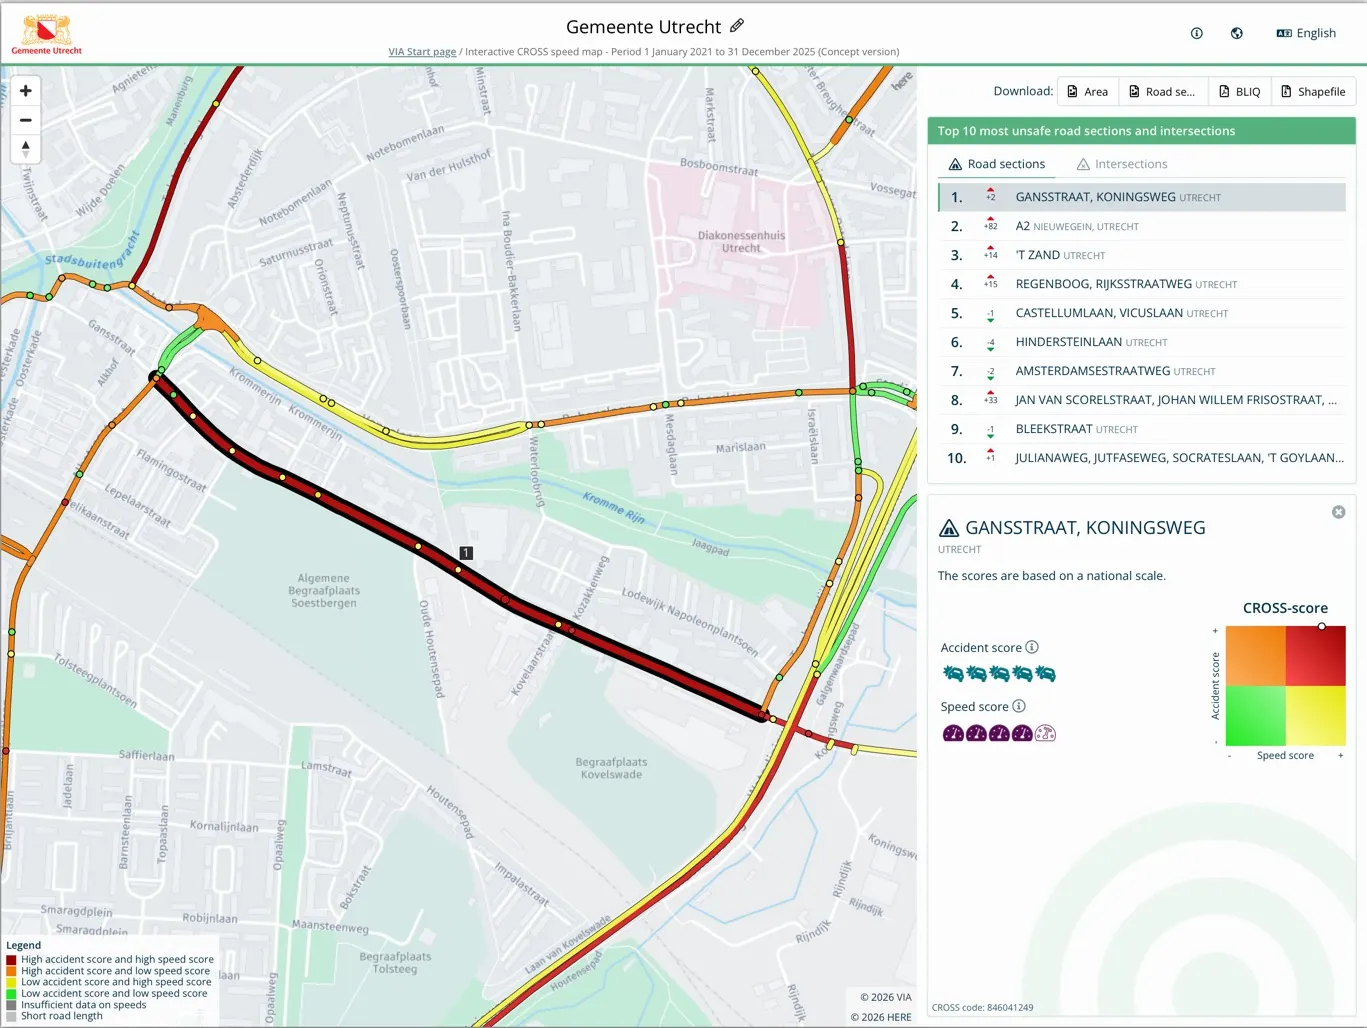
The CROSS Top 10 (top of the sidebar) is based on the Collision Score and specific to the selected target area. There’s a separate list for road sections and junctions. Clicking on a location in the list zooms in on the map, and the CROSS score (bottom of the sidebar) is indicated with a dot in the CROSS matrix based on the Collision and Speed scores. See Figure 4.
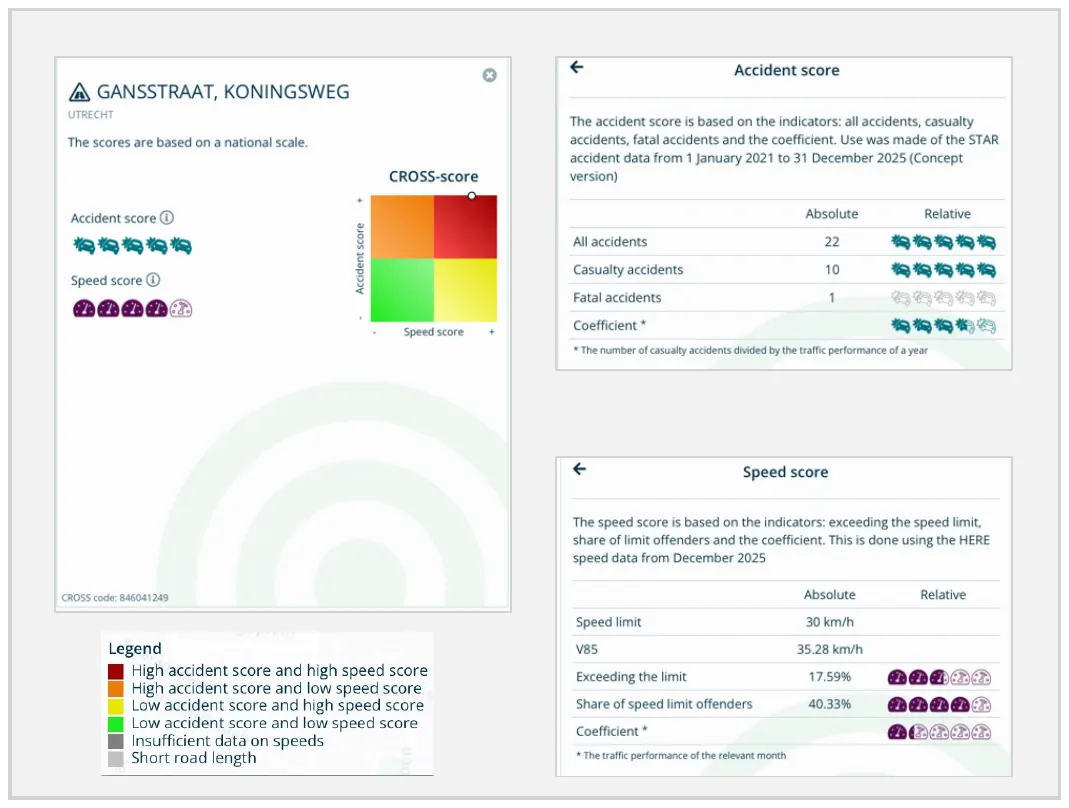
The CROSS score was determined for each road section and junction. The CROSS score and the colour of a road section and junction on the map are indicated by a dot in the CROSS matrix. Clicking on a road section or junction on the map or in the Top 10 list displays the Collision score and Speed score visually. The more fully coloured the visual, the higher the score. Clicking on the Collision or Speed score displays the indicators [See Appendix C], also displayed with a visual, that determine the score. See Figure 5.
Menu functions:
- Top menu bar: with options for 1) selecting a target area, 2) information and brief instructions and switching between 3) countries and 4) languages.
- Download options: 1) target area map, 2) selected route section/junction, 3) BLIQ report of target area and 4) Shapefile for GIS applications.
8. Conclusion
CROSS combines commercially available traffic data from HERE with police reported road collision data and presents these data and several analytics of these data on a selected map of roads. This allows policy makers, road authorities, police officers and other professionals to interpret these data. CROSS can assist them to decide how to direct road related road safety interventions to the most relevant roads. Relevant roads can be roads with a high road collision frequency, high speeds, high traffic volumes or a suitable combination of these. The paper offers transparency of the data-analyses applied by CROSS.
9. Discussion and further development of CROSS
The CROSS method has been developed to assist policymakers, police officers, politicians and other relevant professionals to analyse traffic and traffic safety data without them having to dive deep into the technical requirements to dig into the data themselves. This requires, of course, that these users can sufficiently trust these data and the analyses being performed in CROSS. This paper reveals the techniques behind CROSS, to allow for critical review, which in turn can open up opportunities to further enhance the methods.
We have shown that the traffic data supplied by HERE is now representing a substantial proportion of all vehicles, showing an average cover of at least 20% for most major roads. For low order roads with very low traffic volumes, we believe these data are as yet not sufficiently representative for all traffic, which is why we do not yet offer analyses of these lower order roads (i.e. the Functional Road Class 5 of the HERE network). We hope to be able to add these roads to our network sometime in the future once the HERE dataset has increased sufficiently.
The way CROSS now handles traffic volume to construct a speed score, is open to improvement. We chose to reduce the weight of this indicator in the averaging of the different Speed scores, but we are in search of more sophisticated methods.
The current version of CROSS shows route sections, and junctions, with either high vehicle speeds or high collision frequencies, or both. More often than not, such road sections form a part of a longer route, that may or may not show similar scores for other segments or junctions. CROSS-users could benefit from a functionality that collects similar sections or junctions and shows which roads could be a good candidate to redesign or be subject of other interventions regarding speed or safety. We hope to develop such a functionality in the future.
CROSS uses collision frequencies, speed data and traffic volume data, combined with network properties of roads and junctions. As is commonly known, the road safety performance of roads concerns many other factors such as road width, presence of bicycle infrastructure or sidewalks, construction properties of junctions, presence of trees or other obstacles near the road and many more. At this stage, CROSS cannot take these other factors in account yet. We hope to be able to present these functionalities in a next version.
10. References
- [1] WHO Global Status Report on Road Safety, 2023
- [2] ITF, The Safe System approach in action, 2022
- [3] HERE, traffic analysis developer guide, 2025
- [4] Geetam Tiwari, International Journal of Injury Control and Safety Promotion, 2022 (29:4) 421-422
- [5] Rachel Talbot et al, Accident Analysis and Prevention 2024 (195) 107409
- [6] Ibtissam El Khallai, Eurasia Proceedings of Science, Technology, Engineering & Mathematics 2023 (22) 99-110
- [7] Fred Wegman et al, IATSS Research 2015 (39) 19–25
- [8] Rune Elvik, Traffic Safety Research vol. 6 (2024) e000051, https://doi.org/10.55329/lksd3366
- [9] Rune Elvik, Research in Transportation Economics 47 (2014) 27-36
- [10] Thomas Ojo et al (2019), Traffic Injury Prevention, 20(2), 216–219.
- [11] Marianna Impraliou et al, Accident Analysis and Prevention 130 (2019) 84–90
- [12] ETSC Pin flash 35, 2019
- [13] Xin Pei, Accident Analysis and Prevention 48 (2012) 464–471
- [14] INWEVA https://maps.rijkswaterstaat.nl/dataregister/YnZrUmdrVE1mNzBi/eng/catalog.search#/metadata/054ab8be-0eaa-440c-840c-47eca8643aa8
Appendix A: Increase of the HERE set over time
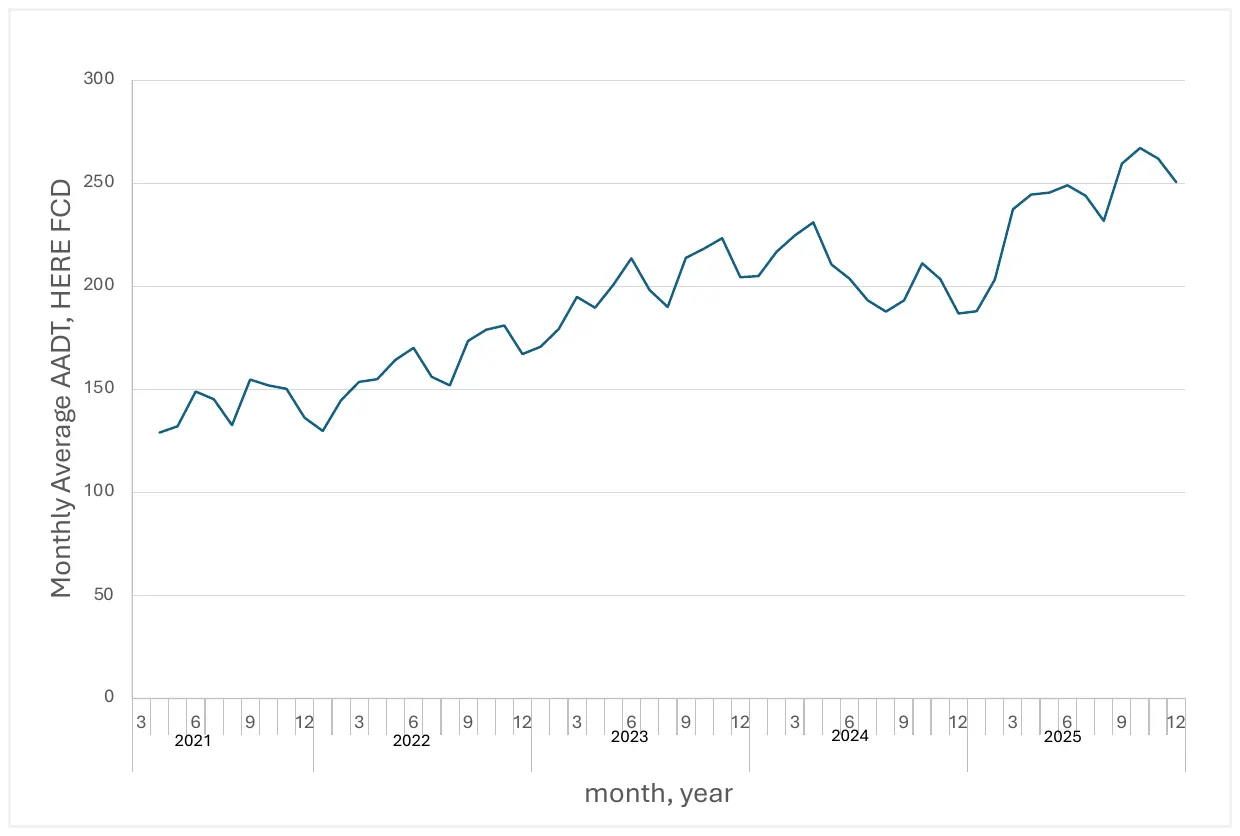
To get an impression of the increase in the number of vehicles in the HERE-set, we used the monthly values of AADT (Annual Average Daily Traffic) based on the HERE set, for each section of the network. Based on these values, we calculated the traffic volume of each section, by multiplication of the AADT and the section lengths. We divided the sum of these traffic volumes to achieve the average AADT, thereby compensating for a possible increase in the network length.
This way, we obtained a network average of the AADT per month. In Figure A1 we show the values of this network average AADT between April 2021 and December 2025. The figure shows a more or less steady increase, of almost a factor of 2 in less than 5 years, indicating an increase in the proportion of the HERE set, as compared to all vehicles, since the fleet size in the Netherlands was much less in the same period. The increase shows some irregularities, e.g. a dip between April 2024 and April 2025. HERE explains this is a consequence of temporary changes in the set of data providers. HERE Traffic relies on hundreds of probe providers, which are constantly evaluated for quality. This ongoing evaluation can lead to contract terminations and new contracts with different providers [private communication].
Appendix B: Comparison of HERE Floating Car data with Induction loop vehicle counts in the Netherlands
The FCD supplied by HERE are based on the data provided by their contractors. HERE does not have any means to know to what extent these data represent the total fleet or the actual traffic on the road segments for which they supply their data. For an impression of this representation, we compared HERE FCD with the traffic data available in the Netherlands as based on data collected by Rijkswaterstaat and publicly made available through their INWEVA system, for 2024. Through this system, road traffic data of Monthly Average Workday Traffic (MAWT) (vehicle counts) is made available for several hundreds of motorways sections. We compared these data with the corresponding HERE FCD.
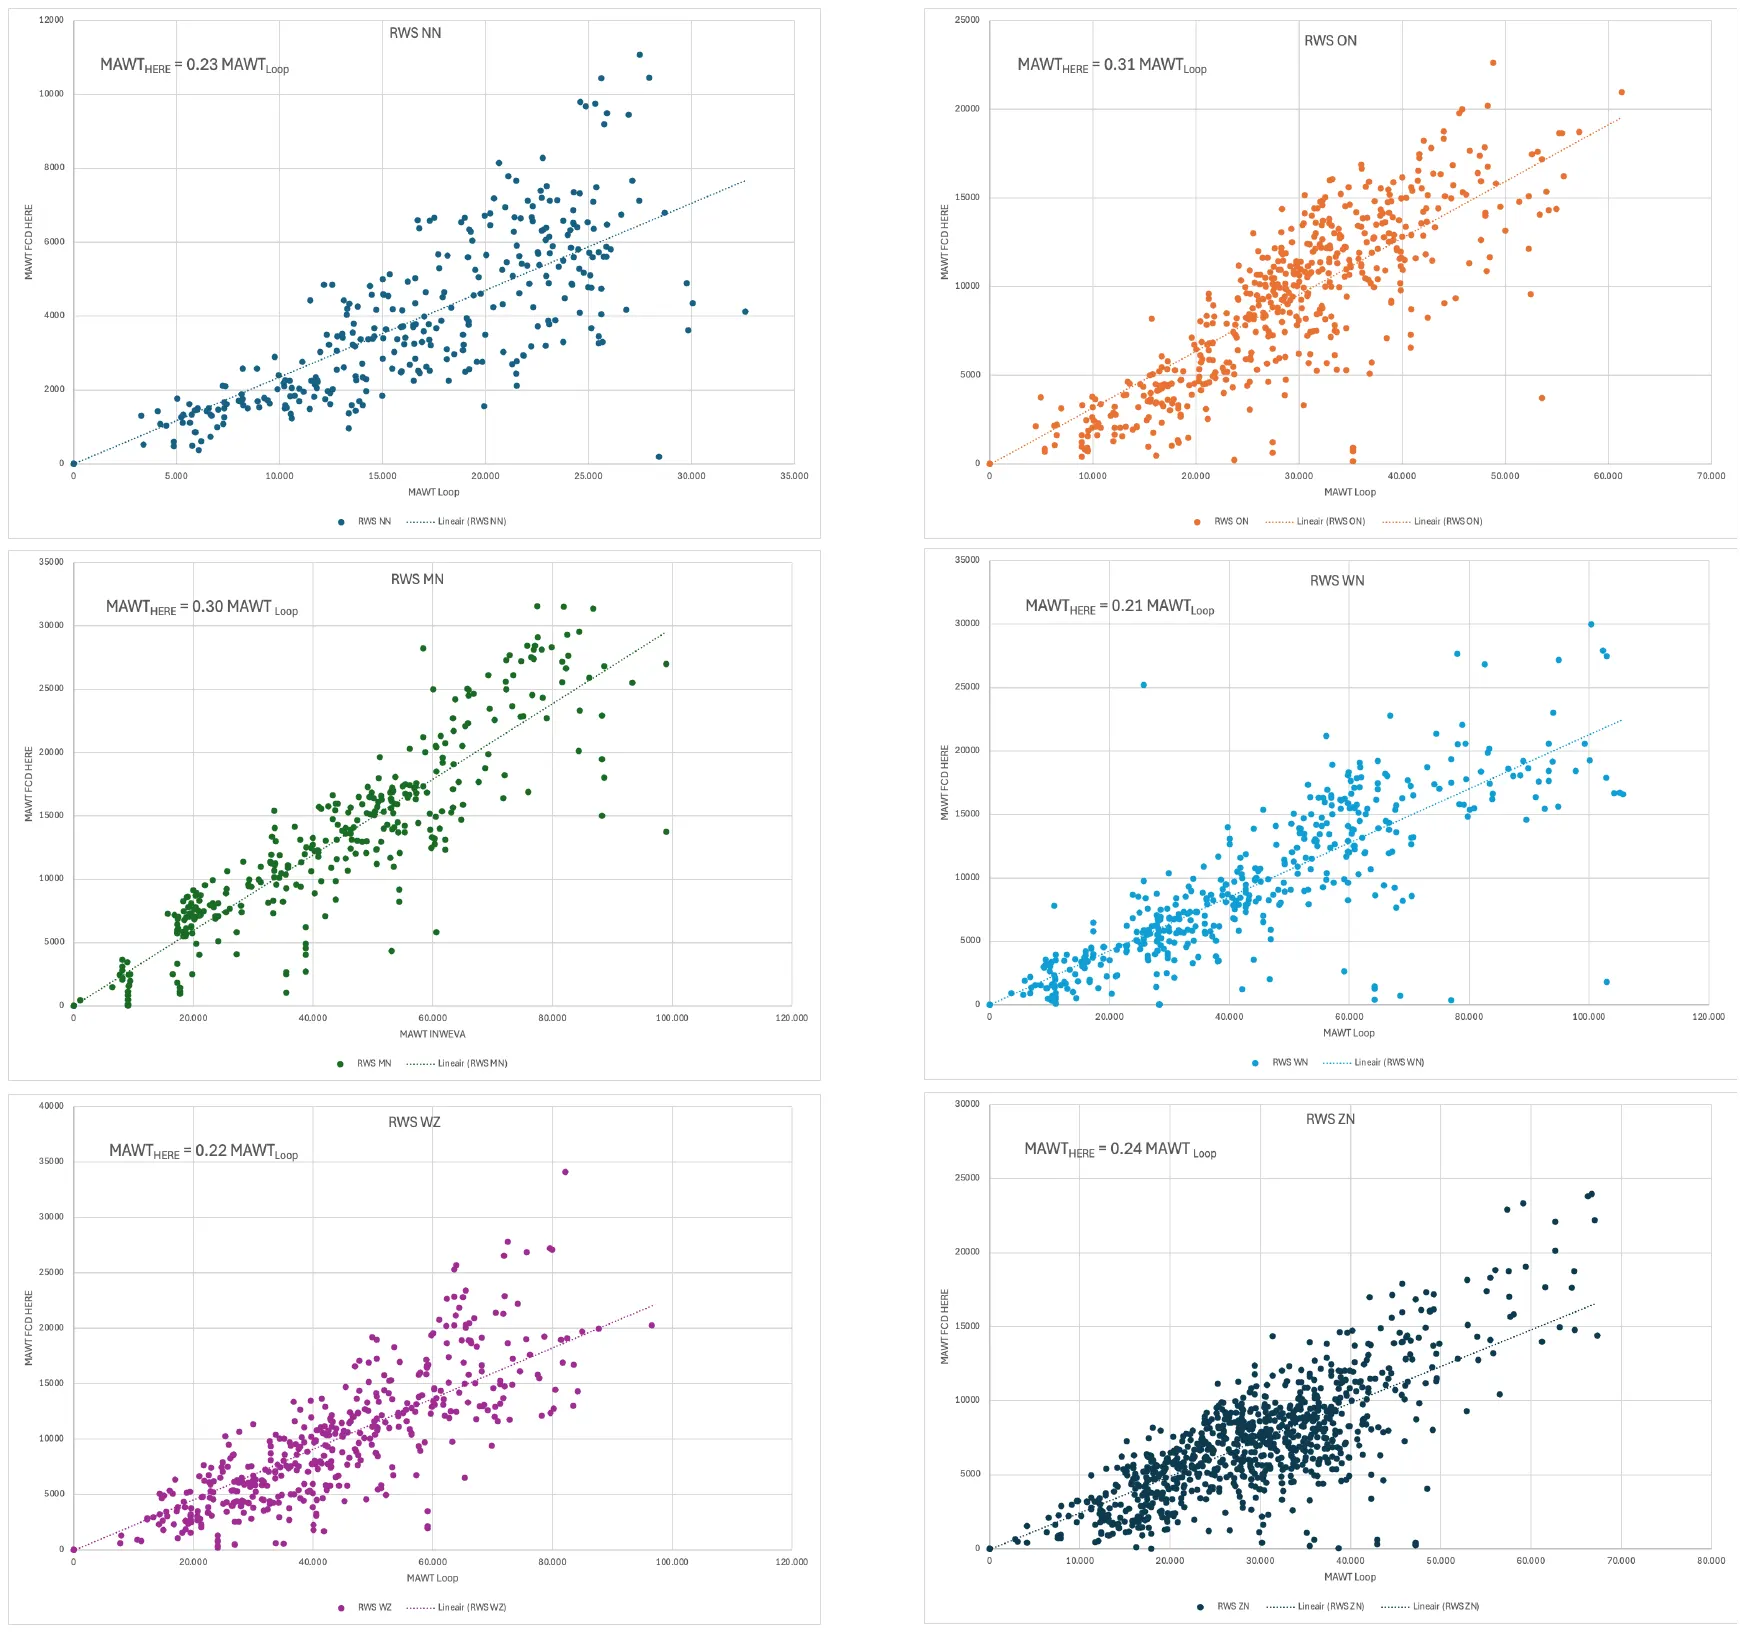
The INWEVA data are indexed with a region-code: There are 7 regions: North of the Netherlands (NN), East of the Netherlands (ON), Middle of the Netherlands (MN) etcetera. A comparison between INWEVA and HERE shows that the representation of HERE FCD depends on the region. The reason for these differences are as yet unknown. Explanations can e.g. be found in the correlation between region and other factors such as income, migration background, availability of public transport, or in the proportion of long-distance traffic on the motorways (in the East of the Netherlands (ON) and the Middle of the Netherlands (MN)).
These main roads cannot be seen as a representative set of all Dutch roads, but we believe the similarity of HERE FCD and INWEVA loop data suggests that, depending somewhat on the Dutch region, HERE represented between 20% and 30% of the vehicles in the Netherlands in general in 2024.
Appendix C: Explanation of score calculation
Collision score
To determine the Collision score, four indicators are combined: the total number of collisions, the number of casualty collisions (collisions where at least one person has been injured or killed), the number of fatal collisions and the risk rating. These numbers are based on 5-year collision data, where the numbers of each year are weighted according to the weights in table C1, for the five most recent years t-4, … , t
| t-4 | t-3 | t-2 | t-1 | t |
|---|---|---|---|---|
| 0.0667 | 0.1333 | 0.2000 | 0.2667 | 0.3333 |
Table C1: weights used to determine the average annual number of collisions, casualty collisions and fatal collisions
This weighting by recency is needed to prevent that collisions that happened several years ago, and might be followed up by interventions, would still draw attention that is no longer needed. A total of 80% of the score is determined by the last three years. This way, new risk locations attract more attention.
The risk rating is calculated by dividing the weighted average annual number of casualty collisions by vehicle distance travelled: the daily motor vehicle volume of a year multiplied by the road length. For junctions we use the number of vehicle passages divided by two.
To apply the Collision score nationwide, a ranking is determined for each indicator using the statistical method Percentile Rank, with zeros suppressed. The ranking is based on the rule that route sections and junctions with one collision are assigned a ranking of “0.” By excluding route sections and junctions with zero collisions from the ranking, a consistent ranking is created that aligns with the four-color matrix on which CROSS is based, with road sections and junctions without any collisions removed.
The highest value per indicator is assigned a weight of 1, and the lowest is assigned a weight of 0. To determine the over-all Collision score, the average of the four indicators is calculated for each road section and each junction. Each score carries equal weight. Subsequently, these scores are again ranked. The Collision score equals this final rank.
Speed score
The Speed score is based on the following indicators:
- The excess speed (if any) of V85 as compared to the speed limit
- The proportion of vehicles with a speed above the speed limit
- The traffic volume
The set of roads and junctions with a V85 below the speed limit receives a Speed score based on indicators 2 and 3. For the set of roads and junctions with a V85 above the speed limit, all three indicators are used. The Speed score is then obtained by averaging these three indicators, where the traffic volume is first divided by 3, to prevent motorways to dominate the overall ranking. In effect, traffic volume receives a three times lower weight than the other two indicators.
The Speed score is calculated using speed data and the number of vehicles per route section or junction from the most recent month. For junctions, the last observed speed of the traffic driving in the direction of the junction is taken.
To apply the Speed score nationwide, a ranking is determined for each indicator using the statistical method Percentile Rank. These ranks are averaged and these averages are again ranked between 0 and 1 to obtain the Speed scores. The traffic volume ranking is weighted lower because roads with a lower road function have proportionally less traffic. This is corrected by an arbitrary method of dividing the traffic volume indicator by three. The highest value per indicator is assigned a weight of 1, and the lowest is assigned a weight of 0. The Speed score is the average of the three indicators.
Road sections (or junctions) with V85 below the speed limit are all presented in the left part of the CROSS matrix, while the other road sections and junctions are presented on the right of the matrix. In other words these two groups are scored, ranked and presented separately. The right part of the Matrix therefore only shows roads and sections with a V85 above the speed limit.
Appendix D: Overview of a selection of reports in which CROSS has been applied
(All reports are in Dutch)
- Risk Analysis Strategic Road Safety Plan for the Municipality of Tynaarlo (2024): https://raad.tynaarlo.nl/documenten/Bijlage-2-Risicoanalyse-SPV-gemeente-Tynaarlo-v1-0-240410.pdf
- Risk analysis municipality Leeuwarden (2022): https://leeuwarden.bestuurlijkeinformatie.nl/Document/View/f3636de7-d849-4937-a412-d03f48835a34
- Research report: Road safety survey in Woudenberg (2024): https://www.woudenberg.nl/fileadmin/user_upload/8.c_Rapportage_verkeersveiligheidsenquete_Woudenberg.pdf
- Information for the council Municipality Dalfsen (2021): https://ris.dalfsen.nl/Raadsinformatie/Raadsmemo-verkeersongevallencijfers-2020-en-actuele-ontwikkelingen-20210909.pdf
- Risk analysis and implementation agenda Municipality Venlo (2021): https://gemeenteraad.venlo.nl/Documenten/211-2024-RIB-Aanpak-verbeteren-verkeersveiligheid.pdf
- Risk analysis Municipality Altena (2022): https://www.gemeentealtena.nl/fileadmin/Altena_bestanden/Afbeeldingen/Actueel/Mobiliteit_2040/Bijlage_1-_Risicoanalyse_Altena.pdf
- Municipal Road Safety Plan Roermond (2025): https://wijkraadherten.nl/wp-content/uploads/2025/04/Concept-verkeersveiligheidsplan-bijlagen.pdf
- Municipal Strategic Road Safety Plan Maasgouw (2023): https://api1.ibabs.eu/publicdownload.aspx?site=maasgouw&id=100165667
- BLIQ Traffic Safety Report Police Unit Limburg (2024): https://www.trendsportal.nl/collectie-nieuws/verkeersongevallen-limburg/
- Council letter Municipality Hillegom (2025): https://www.bollenstreekomroep.nl/wp-content/uploads/2025/03/Db02-Raadsbrief-Ongevallenanalyse-Hillegom-2020-2024.pdf