Based on the presentation by Erik Donkers at the International Cycling Safety Conference (ICSC) 2021, from the paper “Safe intersections for cyclists” by Erik Donkers and Hugo Coppen.
VIA took part in the International Cycling Safety Conference (ICSC). We shared our knowledge and experience of cycling safety and big data with the participants. We presented our Dutch research, in which we used smart data management, GIS techniques, Floating Car Data (FCD: anonymous speed and traffic measurements from vehicles in traffic), the DNA Dashboard, the Clustered Road Network and the Safety Line Rating. The research used new methods and led to remarkable insights about cycling safety, which we share in this article. The insights are based on the Dutch situation, but the methods and work processes can be applied anywhere in the world.
From a risk approach to a preventive approach
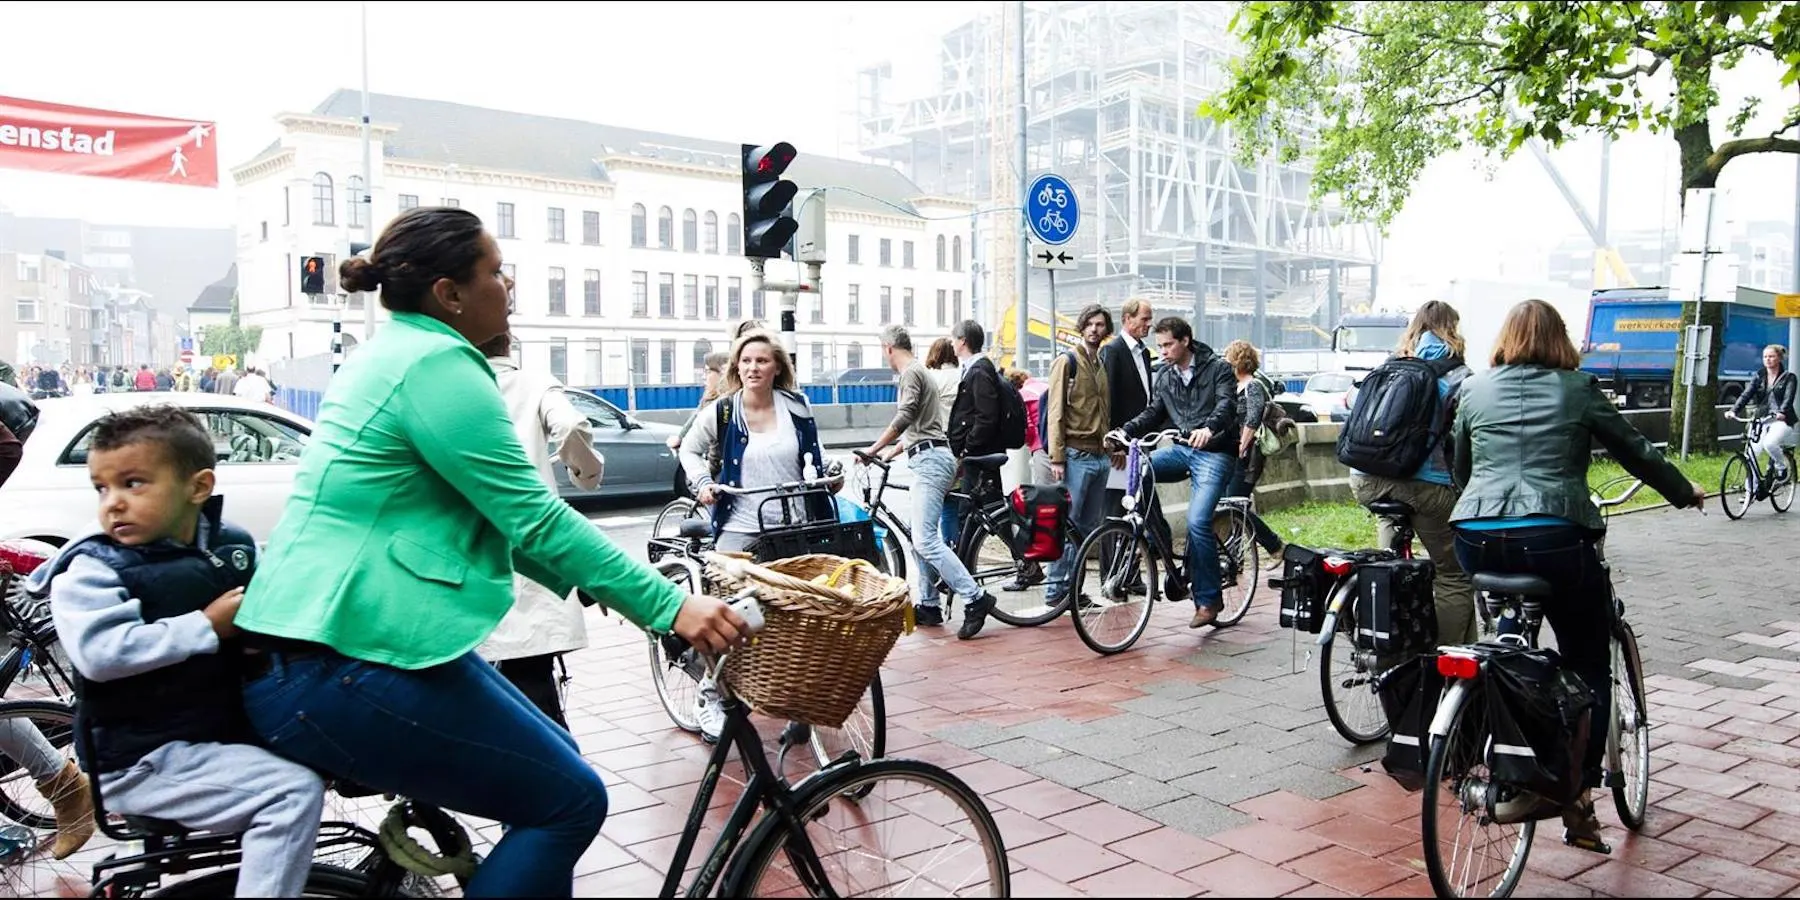
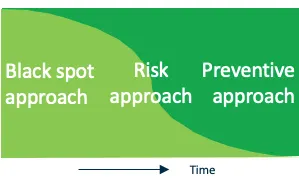
Traffic in the Netherlands has changed. We see a shift from the car to the bicycle and more mobility among older people thanks to the e-bike. At the same time, casualty collisions involving cyclists happen all over the country rather than at a few locations. We call this “data disaggregation”. A black spot approach is therefore no longer effective for road safety policy aimed at cyclists.
So VIA developed a new approach: collision data is the starting point, from which we move to a risk approach and eventually to a preventive approach. A risk approach leads to a policy aimed at situations with a high risk in general. Whether a country can choose a preventive approach depends on its road safety situation. The Netherlands has started on a preventive approach; in the meantime, we use a risk approach. We developed this risk approach in the steps below.
Step 1: cluster data on the map
For a risk approach it is essential to combine collision data (the starting point) with predictive data. Merging these data is difficult and complex, because the datasets are fundamentally different and not comparable. We therefore developed a unique method to cluster different datasets on the map and by their attributes.
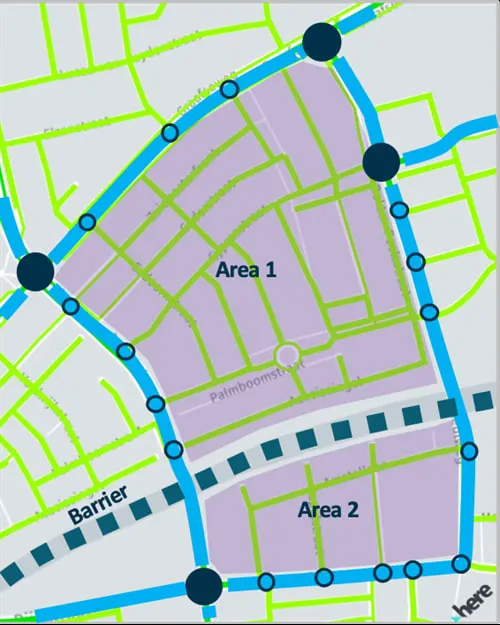
We derived a traffic-oriented road network from FCD, based on the function, design and use of each road. From that network we derived “cluster types”: main network junctions, trajectories (the connections between those junctions), trajectory junctions and areas. Different datasets can be organised and combined in these clusters, so that they become comparable and suitable for analysis. We call this method the Clustered Road Network (CRN).
Step 2: combine the data
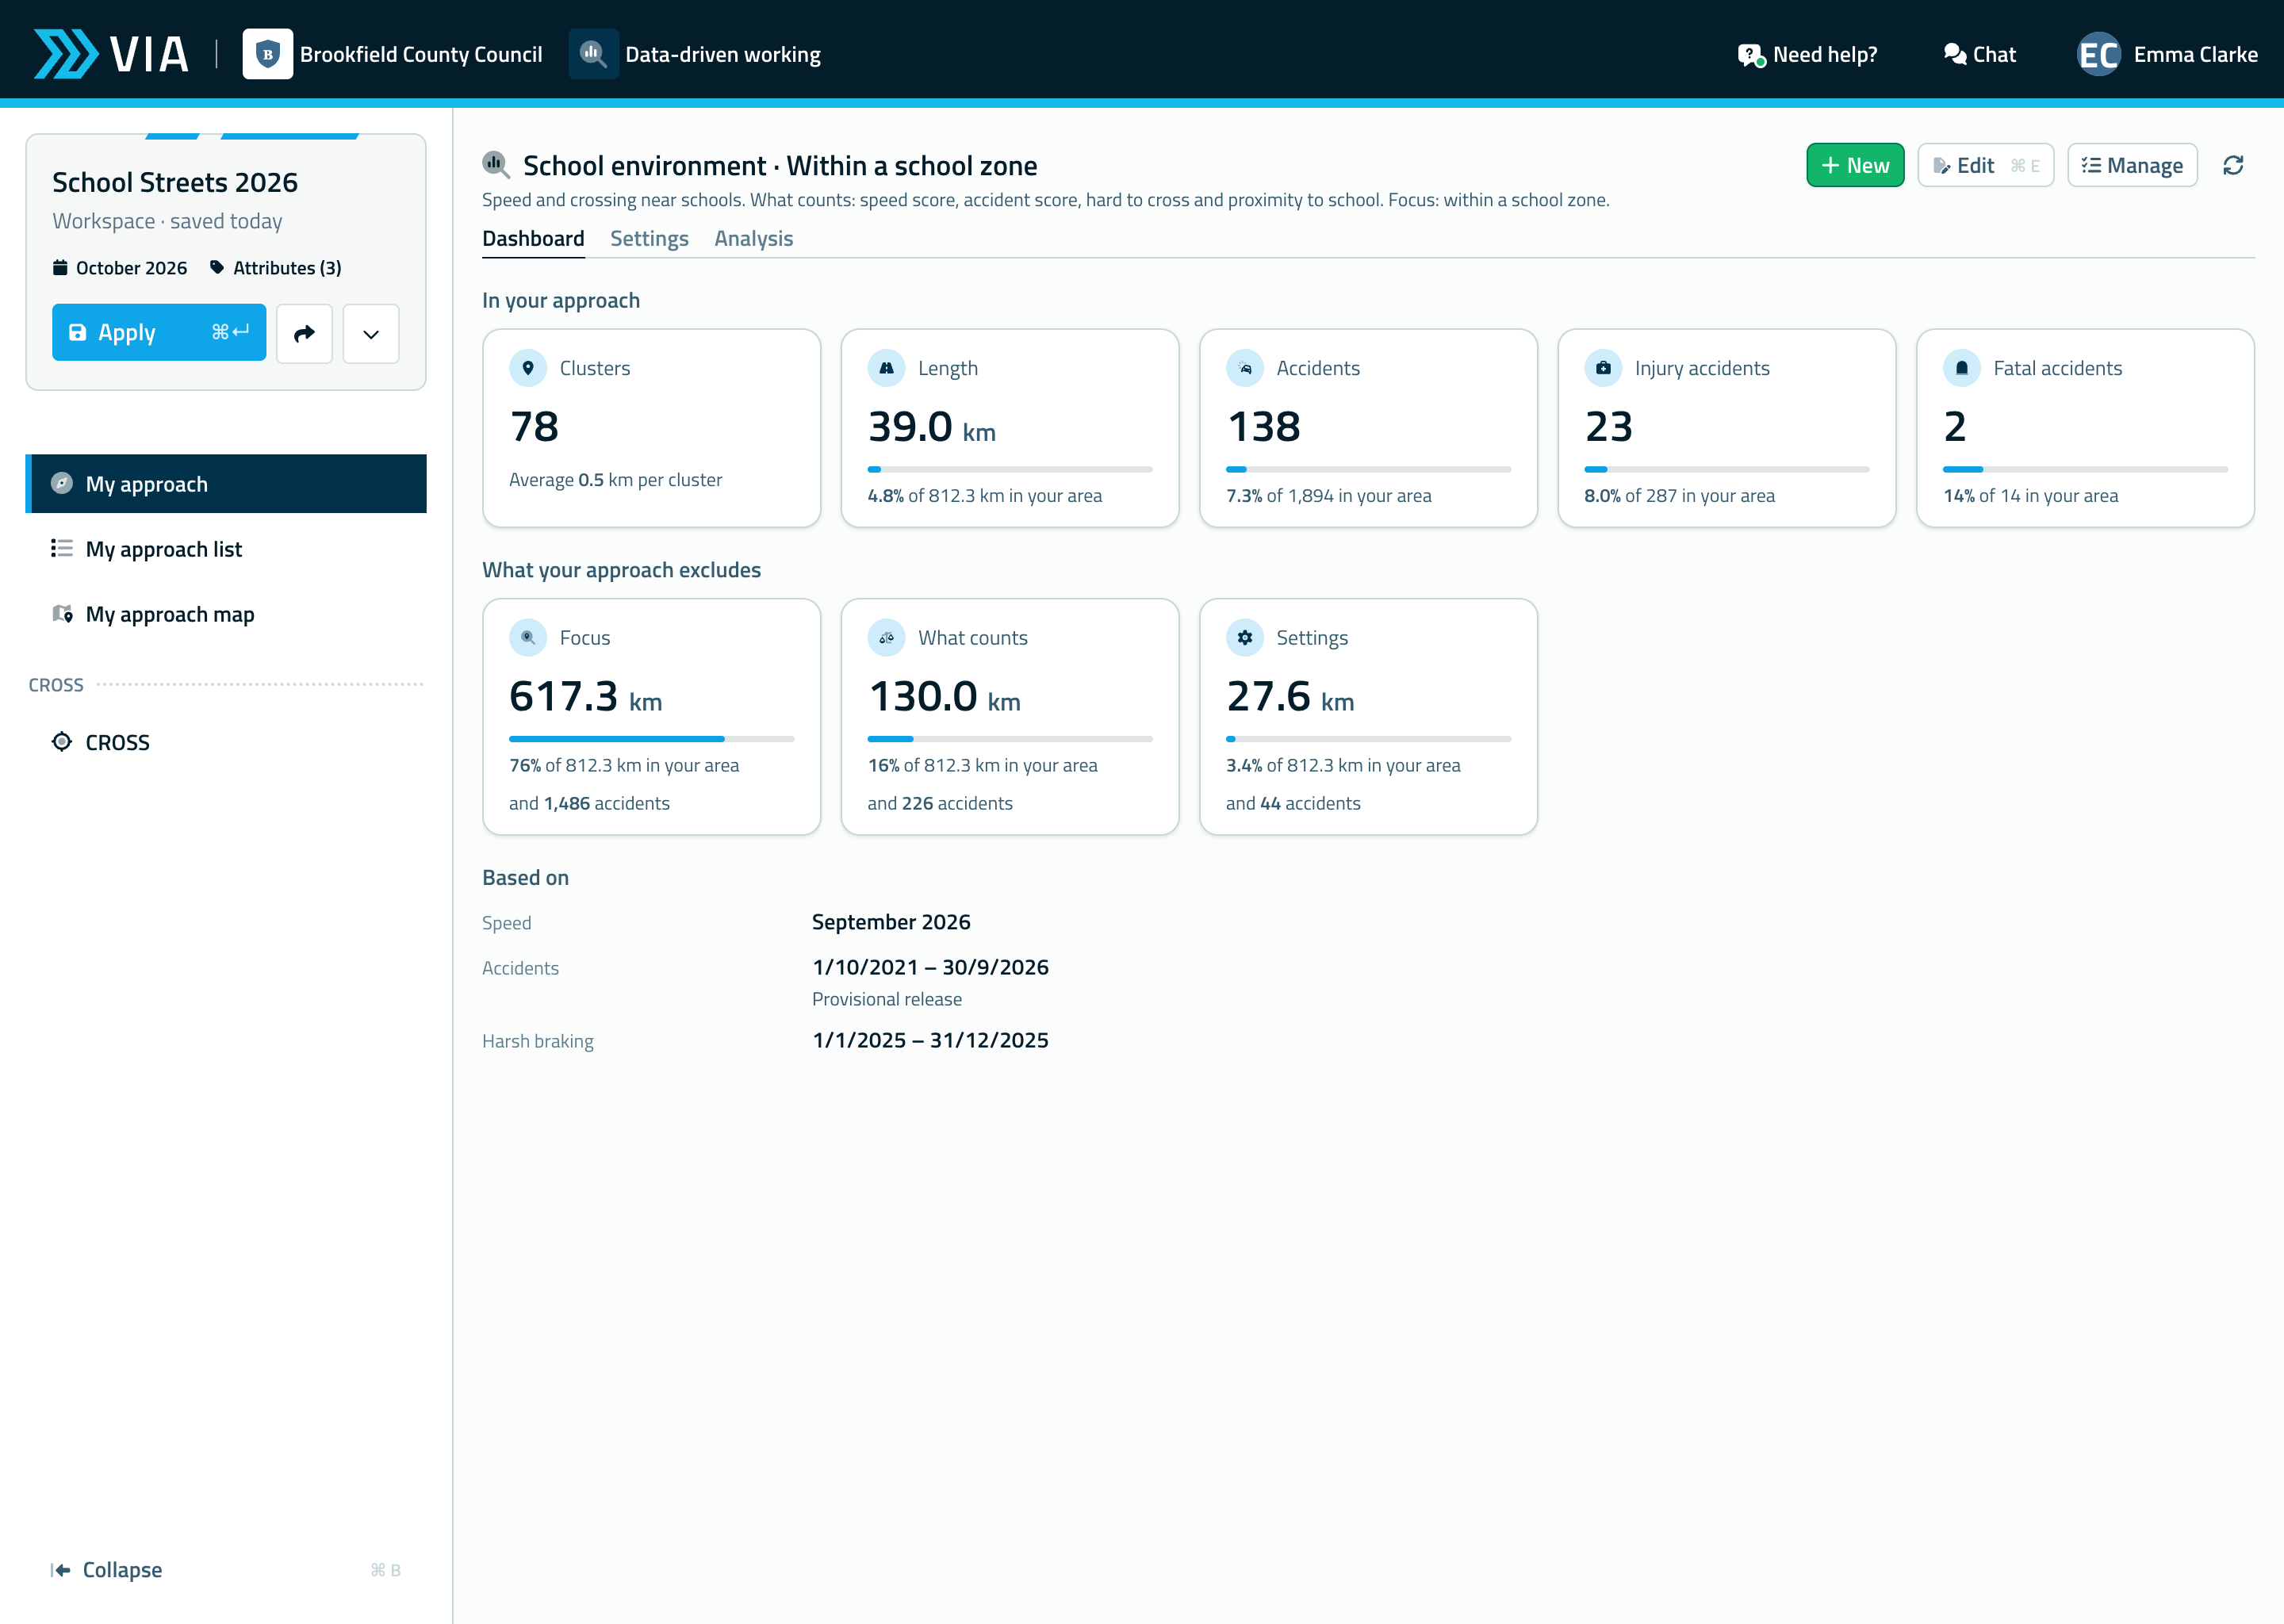
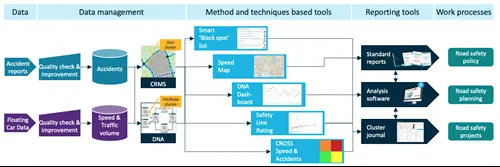
Combining collision reports and the motor traffic volume from FCD within the CRN opens up many possibilities for tools based on methods and techniques, such as the DNA Dashboard and the Safety Line Rating graphs. We used these two tools in this study. The results can feed standard reports, analysis software and cluster journals, to speed up the work process of road safety policy, planning and projects.
Step 3: DNA Dashboard
The DNA Dashboard is a completely new method developed by VIA, based on combining data within the CRN. With data science we derived 40 DNA clusters from the national collision database. A DNA cluster is a group of similar collisions, based on the type of collision, the circumstances and the mix of road users involved. With these clusters we can chart the DNA of the road safety situation of a city.
In this study we compared the DNA of two cities: one where cyclists have priority at junctions and one where they do not. The study shows a large difference in road safety in the DNA main cluster “collisions between non-motorised and motorised road users” at junctions in the urban area. The city where cyclists do not have priority at junctions has the safest score. So we now know that giving cyclists priority at junctions is not always the safest solution.
Step 4: Safety Line Rating
The other method in our study is the Safety Line Rating graph. Unlike the DNA Dashboard, this is an improvement of an existing method. It is based on a collision risk indicator, for which we used collision data from 2015 to 2018 and FCD from January 2019. The x-axis shows the motor vehicle passages per junction; the y-axis shows the casualties per junction.
We divided the junctions into standard junctions, roundabouts and junctions with traffic lights. The graphs show that in the Netherlands roundabouts on the main road network are the most unsafe junctions. As trajectory junctions, roundabouts are only slightly safer than traffic lights. This is a remarkable insight, because for a long time roundabouts were considered the safest solution for junctions.
Conclusion
This study shows that intelligent data management and GIS-based methods and techniques can bring new insights into cycling safety. These new methods will find their way into VIA Software in the short term.