


Analyzing data from the mobile speed camera used to take us days: collecting the data, putting it in order and running the numbers in separate software. With Locations and Routes it takes a few clicks.
 Giedo Donkers
 Hugo Coppen
 Erik Donkers
 Karina Muñoz
 Jolijn Willemse - Donkers
We provide insight into traffic
We help public agencies with data collection, answering residents' questions and building proactive, risk-based road safety programs.
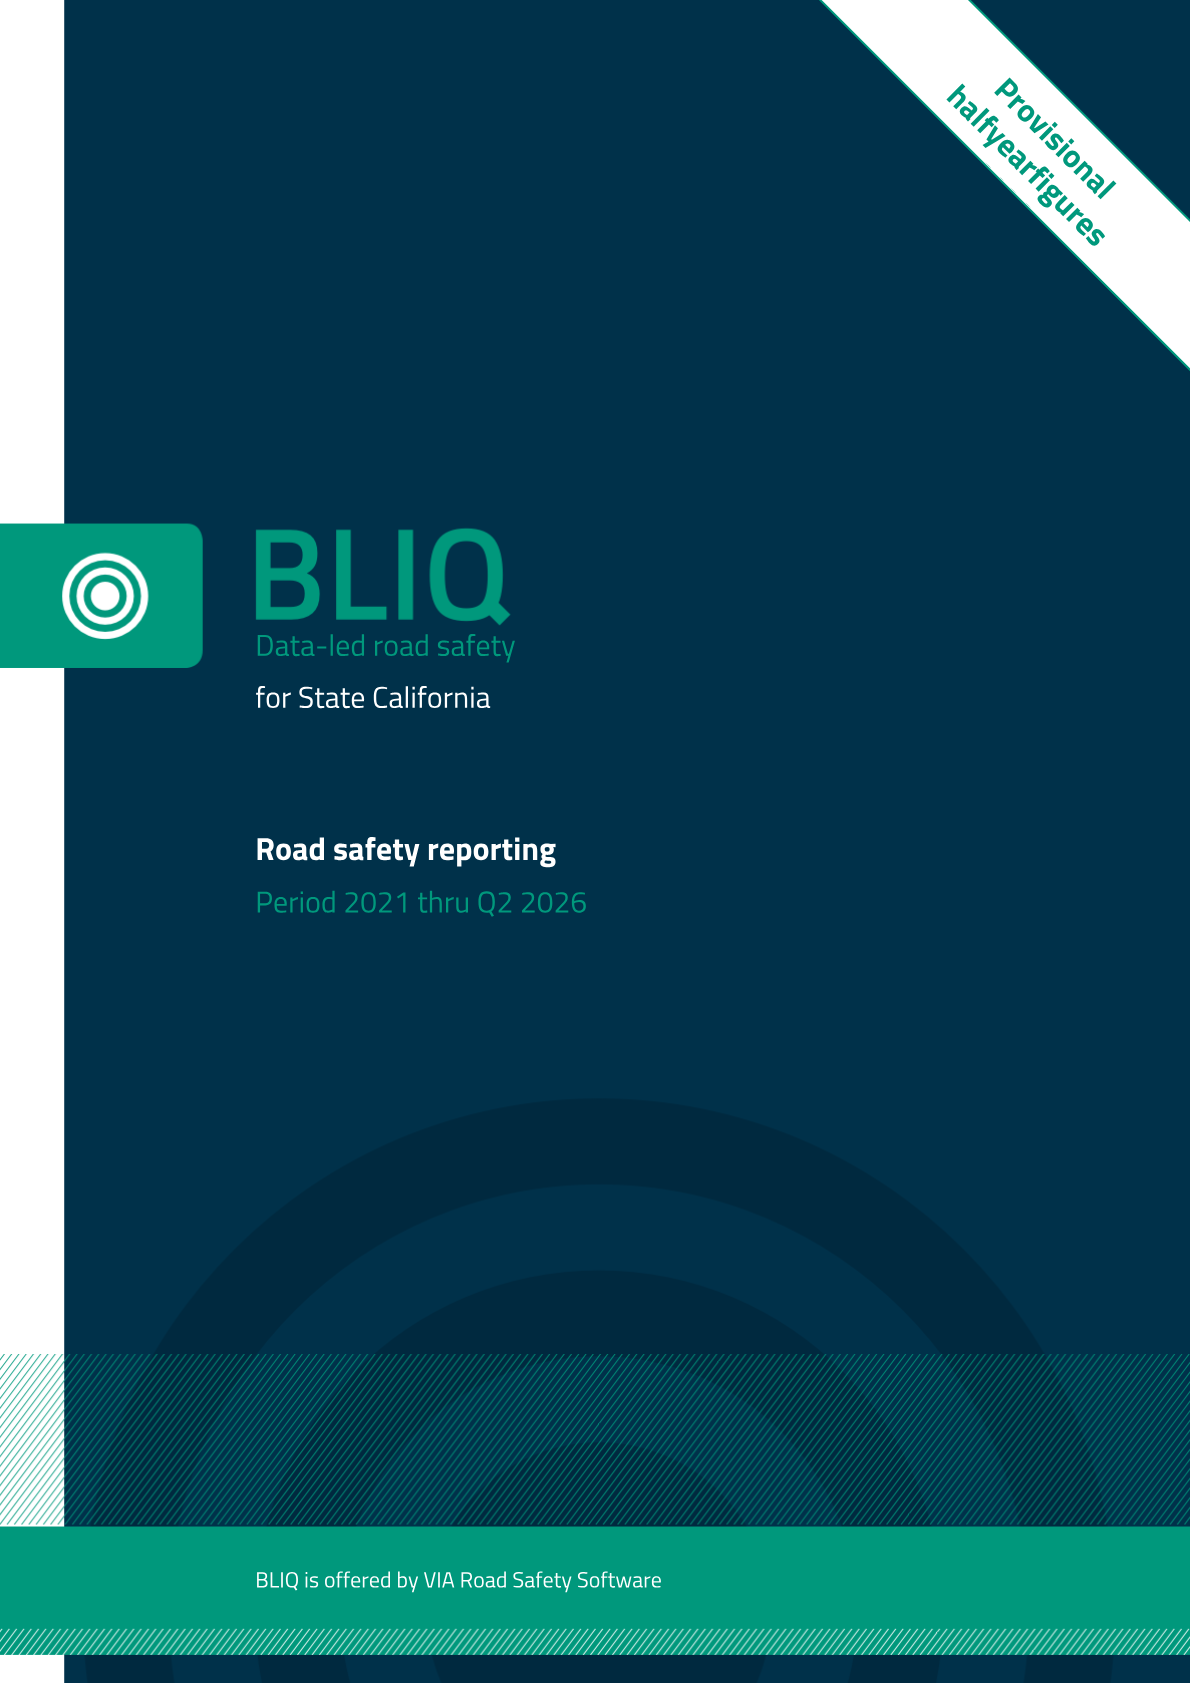
Download our free BLIQ report for California
Our look at road safety in California, from 2021 through mid-2026. Trends in crashes, high-risk locations and speed data. Backed by the numbers.
- Up-to-date and reliable insights
- Ready to use for policy and countermeasures
- Broadly applicable
- Accessible to everyone involved
Proven impact in practice
The speed map shows us, for every street, the 85th percentile speed, the share of drivers speeding and how far over the limit they go. So we know where the problems are, and on which days and at which times to focus enforcement.
Trusted by agencies worldwide
%20--%3e%3cdefs%3e%3cstyle%3e%20.st0%20{%20fill:%20none;%20}%20.st1%20{%20clip-path:%20url(%23clippath-1);%20}%20.st2%20{%20fill:%20%231ef3e4;%20}%20.st3%20{%20fill:%20%23153947;%20}%20.st4%20{%20clip-path:%20url(%23clippath);%20}%20%3c/style%3e%3cclipPath%20id='clippath'%3e%3crect%20class='st0'%20width='32'%20height='32'/%3e%3c/clipPath%3e%3cclipPath%20id='clippath-1'%3e%3crect%20class='st0'%20y='1.445'%20width='32'%20height='29.11'/%3e%3c/clipPath%3e%3c/defs%3e%3cg%20id='HERE-logo-color-XS-32px'%3e%3cg%20class='st4'%3e%3cpolygon%20class='st2'%20points='4.4127%2030.5546%208.8957%2026.2226%20-.0003%2026.1606%204.4127%2030.5546'/%3e%3cg%20class='st1'%3e%3cpath%20class='st3'%20d='M15.3204,16.1995c-.913-1.084-.875-1.674-.305-2.244.685-.685,1.389-.4,2.188.361l-1.883,1.883ZM24.7344,4.2365c.685-.685,1.389-.399,2.188.361l-1.883,1.883c-.913-1.084-.875-1.673-.305-2.244M30.4214,6.1575c-.856,1.274-2.339,3.347-3.899,1.788l3.956-3.956c-.361-.381-.628-.704-.837-.894-2.13-2.13-4.526-2.168-6.409-.285-1.256,1.255-1.579,2.681-1.217,4.051l-1.237-1.408c-.361.19-1.883,1.541-.741,3.557l-1.408-1.179-1.883,1.883,2.53,2.529c-1.959-1.559-4.07-1.407-5.763.285-1.807,1.807-1.693,4.013-.323,5.82l-.267-.266c-1.787-1.788-3.746-1.16-4.716-.19-.742.742-1.199,1.769-1.008,2.491l-3.899-3.899-2.074,2.074,7.665,7.664h4.108l-2.757-2.757c-1.446-1.484-1.484-2.264-.78-2.967.685-.685,1.464-.248,2.872,1.141l2.738,2.738,2.055-2.054-2.587-2.586c1.864,1.407,4.108,1.483,6.105-.495l.038-.038c1.217-1.122,1.579-2.225,1.579-2.225l-1.56-1.046c-.856,1.274-2.339,3.347-3.899,1.788l3.956-3.956,2.473,2.472,2.149-2.149-3.081-3.157c-1.446-1.446-.59-2.796.019-3.31.285.59.685,1.161,1.217,1.693,1.997,1.997,4.584,2.397,6.847.152l.038-.038c1.217-1.122,1.579-2.225,1.579-2.225l-1.579-1.046Z'/%3e%3c/g%3e%3c/g%3e%3c/g%3e%3c/svg%3e)
%20--%3e%3cdefs%3e%3cstyle%3e%20.st0%20{%20fill:%20none;%20}%20.st1%20{%20clip-path:%20url(%23clippath-1);%20}%20.st2%20{%20fill:%20%231ef3e4;%20}%20.st3%20{%20fill:%20%23ffffff;%20}%20.st4%20{%20clip-path:%20url(%23clippath);%20}%20%3c/style%3e%3cclipPath%20id='clippath'%3e%3crect%20class='st0'%20width='32'%20height='32'/%3e%3c/clipPath%3e%3cclipPath%20id='clippath-1'%3e%3crect%20class='st0'%20y='1.445'%20width='32'%20height='29.11'/%3e%3c/clipPath%3e%3c/defs%3e%3cg%20id='HERE-logo-color-XS-32px'%3e%3cg%20class='st4'%3e%3cpolygon%20class='st2'%20points='4.4127%2030.5546%208.8957%2026.2226%20-.0003%2026.1606%204.4127%2030.5546'/%3e%3cg%20class='st1'%3e%3cpath%20class='st3'%20d='M15.3204,16.1995c-.913-1.084-.875-1.674-.305-2.244.685-.685,1.389-.4,2.188.361l-1.883,1.883ZM24.7344,4.2365c.685-.685,1.389-.399,2.188.361l-1.883,1.883c-.913-1.084-.875-1.673-.305-2.244M30.4214,6.1575c-.856,1.274-2.339,3.347-3.899,1.788l3.956-3.956c-.361-.381-.628-.704-.837-.894-2.13-2.13-4.526-2.168-6.409-.285-1.256,1.255-1.579,2.681-1.217,4.051l-1.237-1.408c-.361.19-1.883,1.541-.741,3.557l-1.408-1.179-1.883,1.883,2.53,2.529c-1.959-1.559-4.07-1.407-5.763.285-1.807,1.807-1.693,4.013-.323,5.82l-.267-.266c-1.787-1.788-3.746-1.16-4.716-.19-.742.742-1.199,1.769-1.008,2.491l-3.899-3.899-2.074,2.074,7.665,7.664h4.108l-2.757-2.757c-1.446-1.484-1.484-2.264-.78-2.967.685-.685,1.464-.248,2.872,1.141l2.738,2.738,2.055-2.054-2.587-2.586c1.864,1.407,4.108,1.483,6.105-.495l.038-.038c1.217-1.122,1.579-2.225,1.579-2.225l-1.56-1.046c-.856,1.274-2.339,3.347-3.899,1.788l3.956-3.956,2.473,2.472,2.149-2.149-3.081-3.157c-1.446-1.446-.59-2.796.019-3.31.285.59.685,1.161,1.217,1.693,1.997,1.997,4.584,2.397,6.847.152l.038-.038c1.217-1.122,1.579-2.225,1.579-2.225l-1.579-1.046Z'/%3e%3c/g%3e%3c/g%3e%3c/g%3e%3c/svg%3e)











The software that puts you in control of your traffic data
Crashes, speeds and roadway characteristics: VIA Software brings all the traffic data for your jurisdiction together in one place. So you can work proactively, in line with the Safe System Approach: you decide where to start, find the cause, choose the countermeasure and then evaluate its effect. And you spot risks before a crash happens.
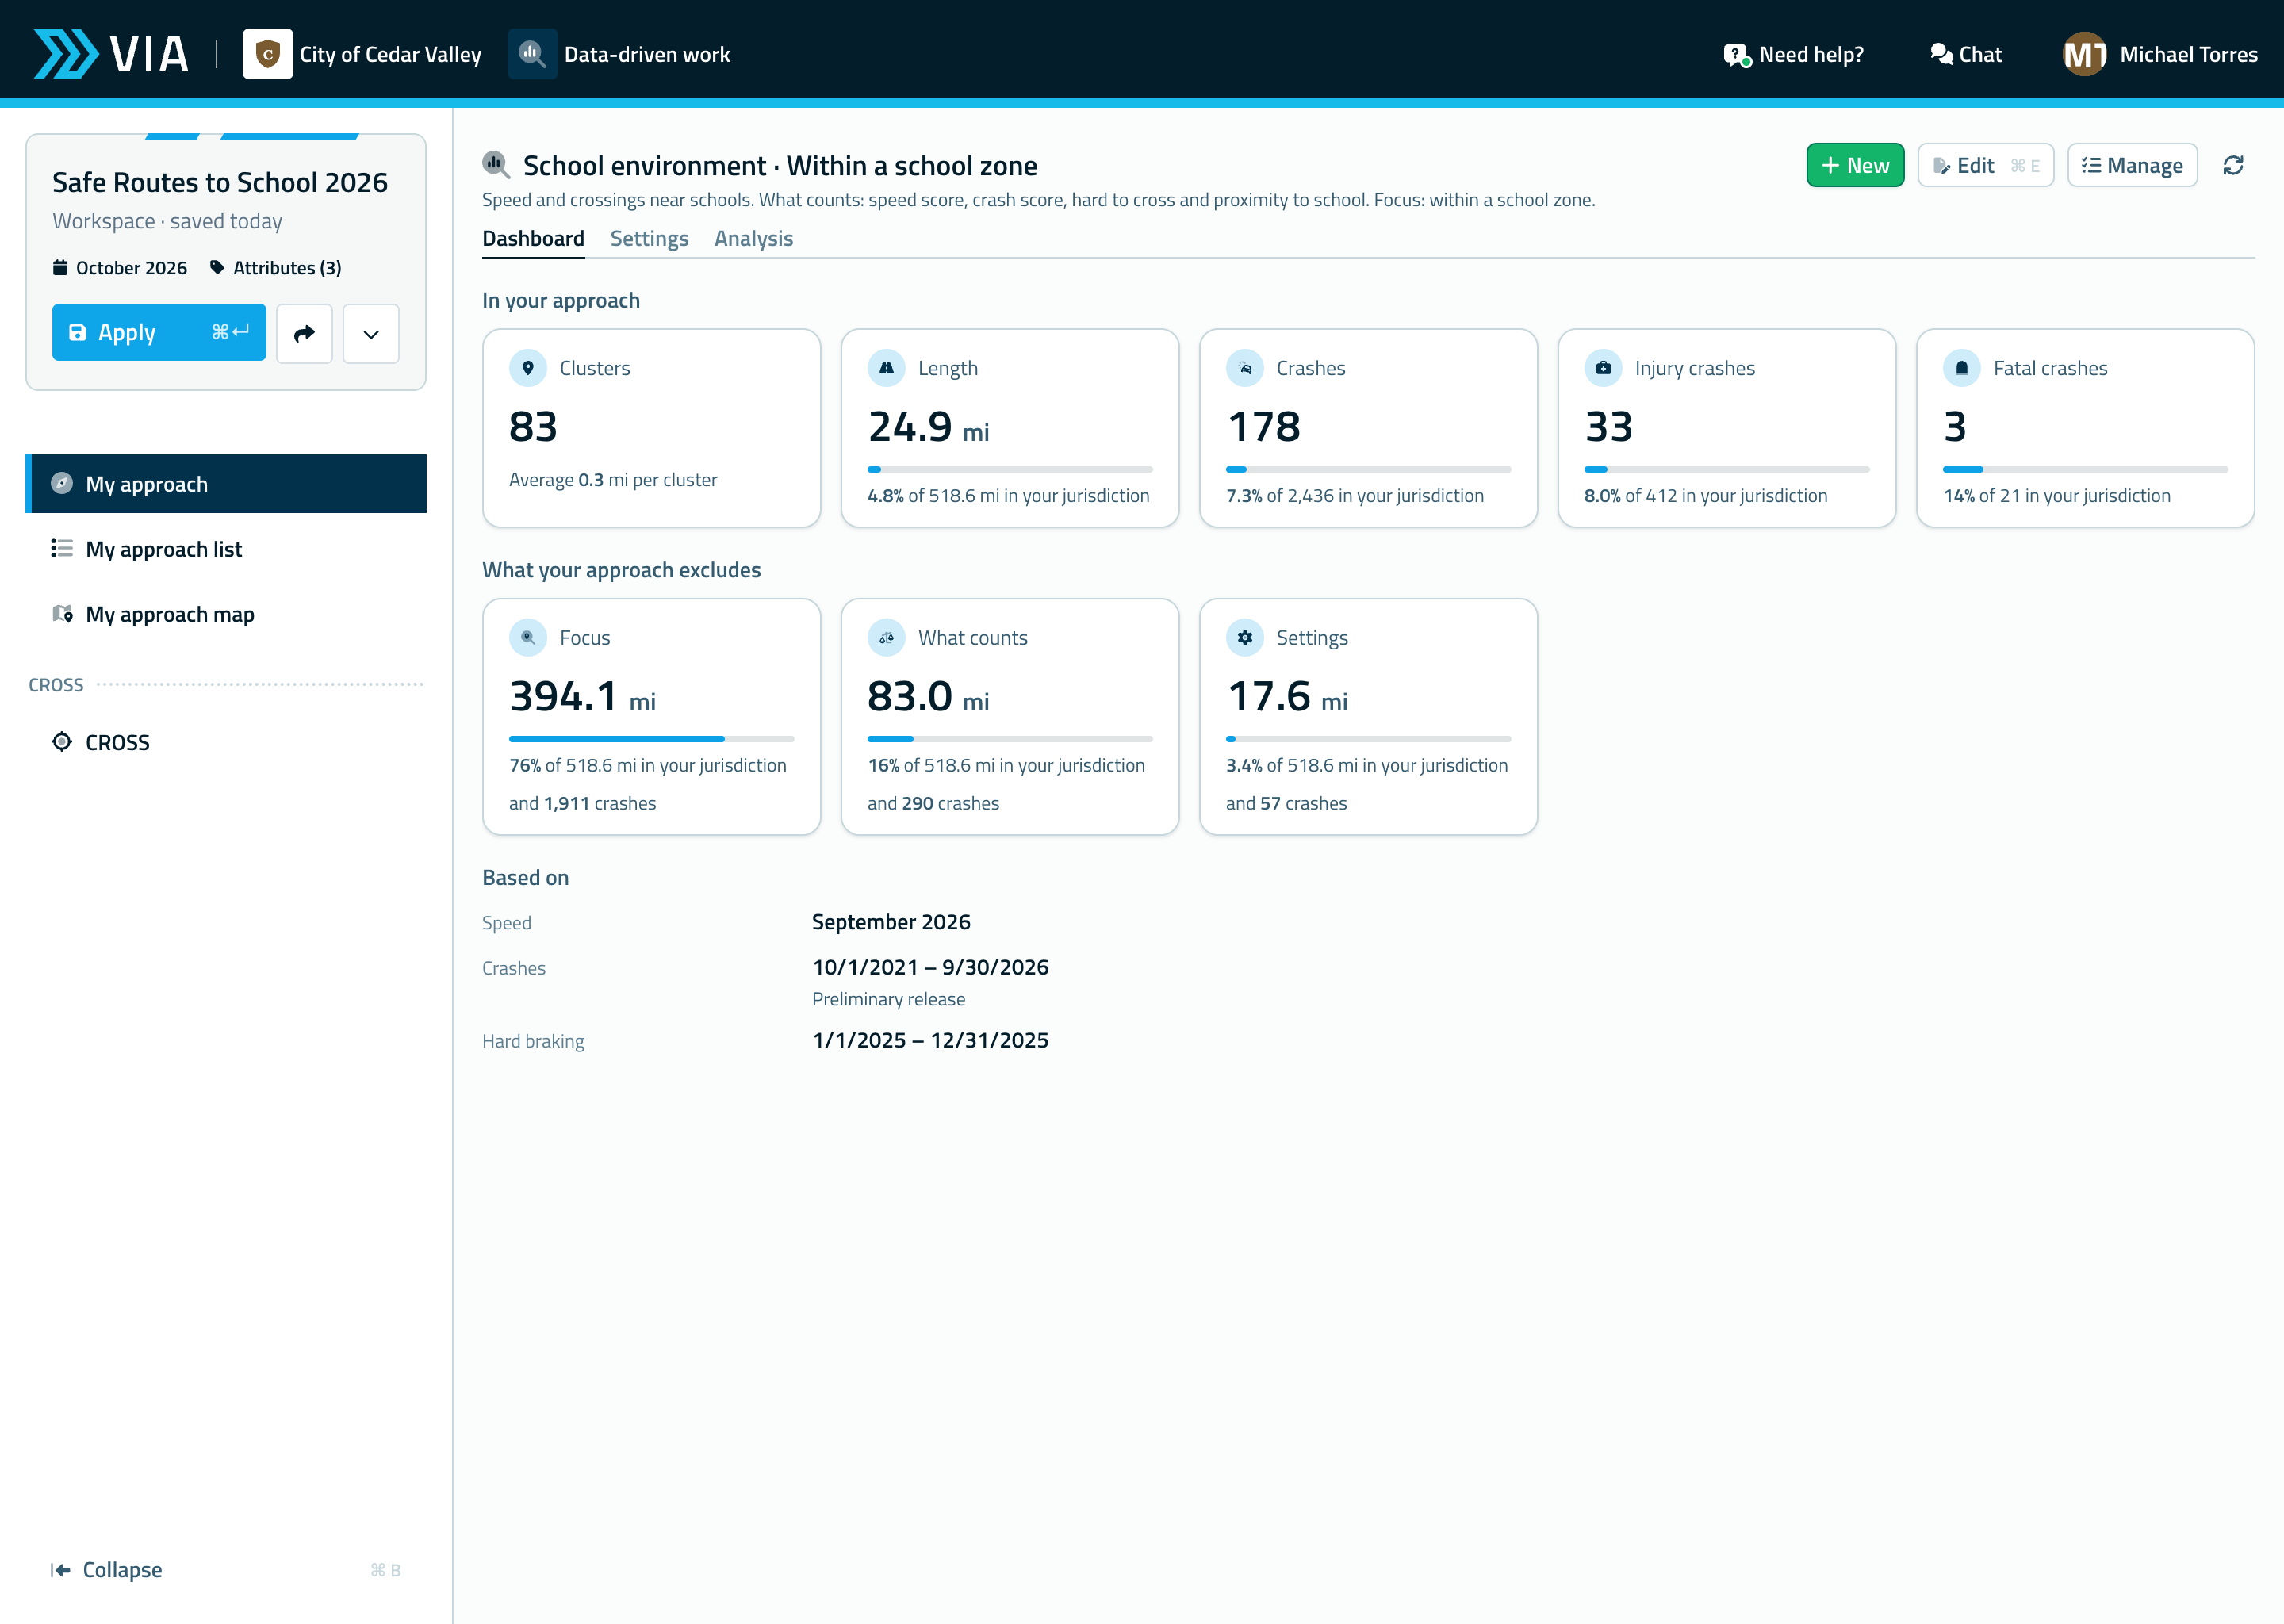
How we help public agencies move forward
Data collection & residents' questions
We help you set up consistent data collection. We also support you in answering residents' questions about road safety in your city, county or region.
Proactive, risk-based safety
The Safe System Approach asks agencies to act on risk, not just on crash history. With up-to-date risk indicators — such as speed, crashes and roadway characteristics — you decide where to act first. And after the countermeasure, you see whether it works.
Expert program support
Our experts help you tackle complex road safety questions — from analysis to countermeasures, and from evaluation to reporting to elected officials.
Everything you need for data-driven road safety
Dashboard
With the most important core insights
Apps for insight
Plenty of apps to gain insight into the traffic data for your jurisdiction.
- Crashes
- Speeds
- Roadway Characteristics
- Data-driven working
- Reports
Crash and speed data
Discover where risks really arise.
Chat directly with our experts
Quick answers, right in the software
Watch a free demo
And much more
Discover all the features in our software
Giedo DonkersHugo CoppenErik DonkersKarina MuñozBook a demo with one of our experts
Less searching. Less doubt. More control over traffic data. See where the risks are, choose the right countermeasure and evaluate its effect.
Yes, I'd like to request a demo