What BLIQ achieved in the Netherlands
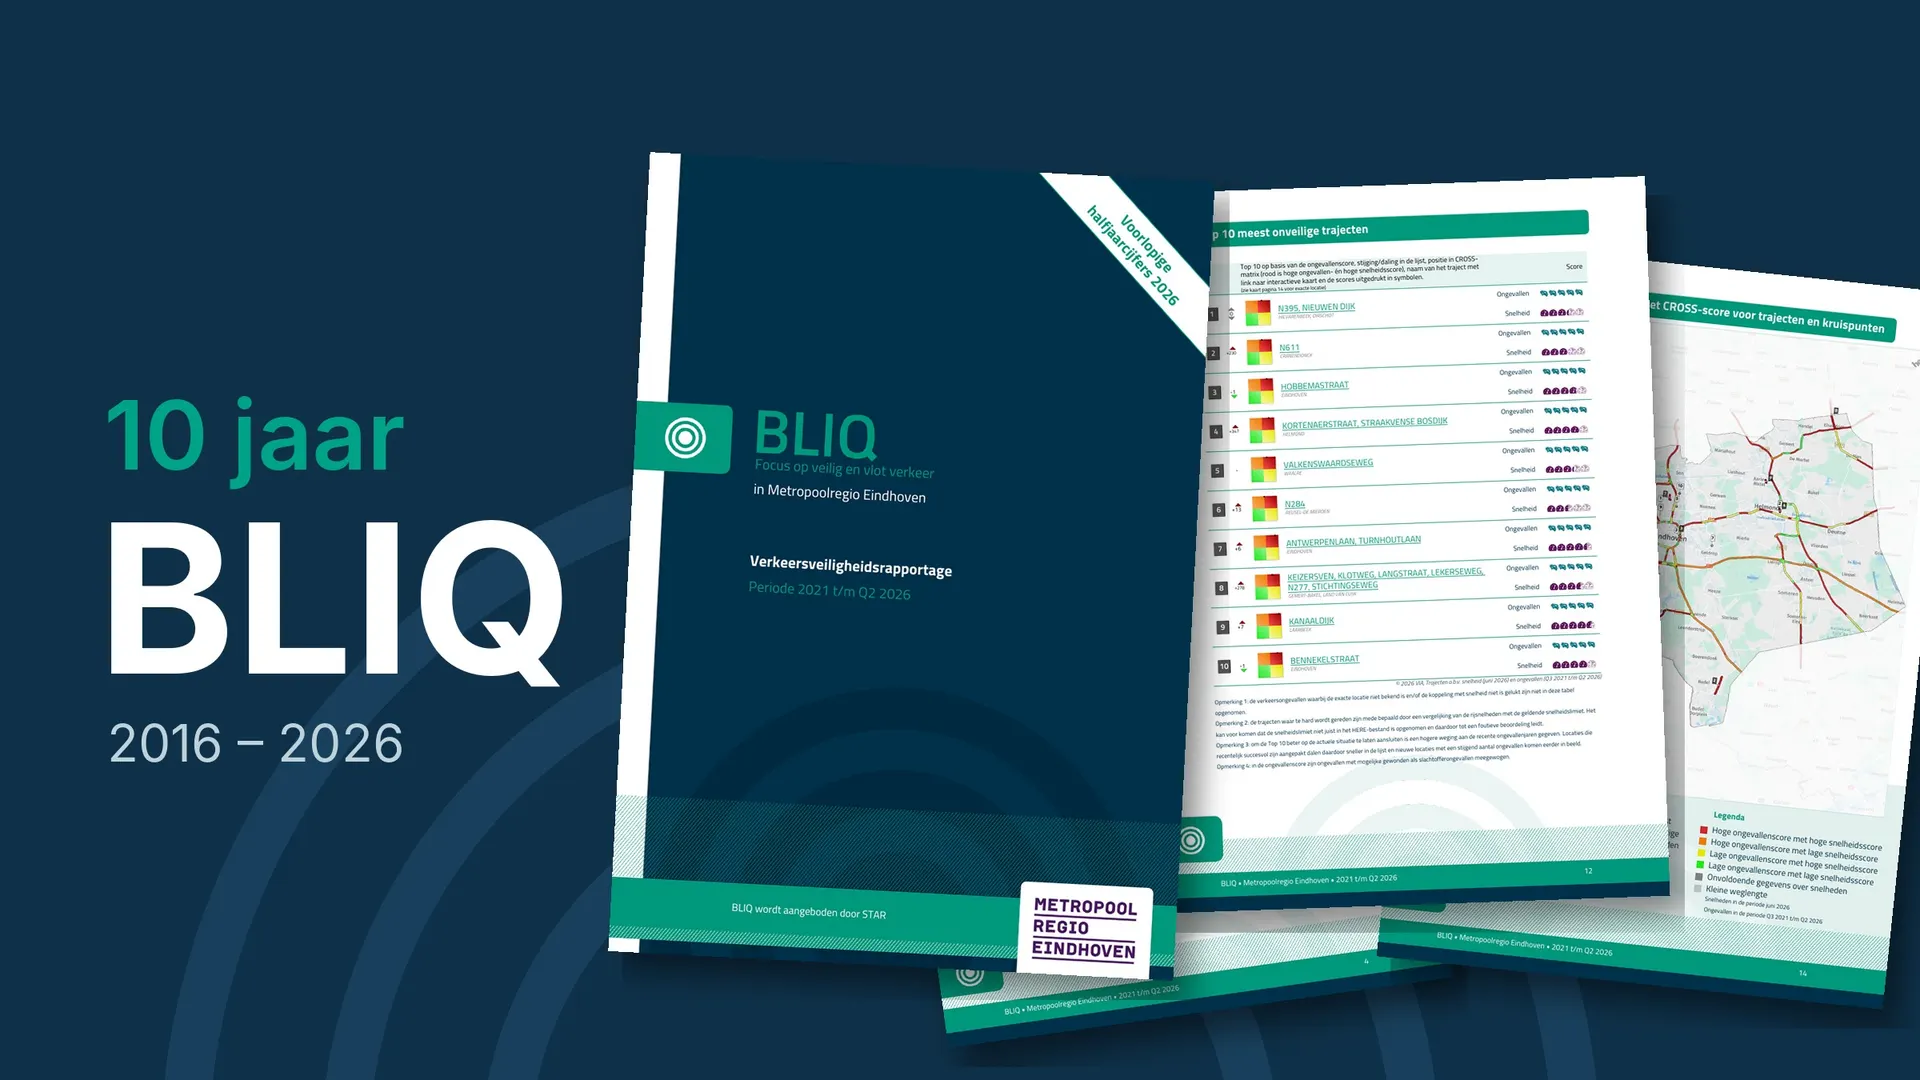
BLIQ keeps city council members and local executives clearly and regularly informed about road safety. The report combines crashes from the police register with speed data from HERE, brought together in CROSS: the risk map of crashes and speeds.
BLIQ is part of STAR, the partnership of the Dutch National Police, the Dutch Association of Insurers and VIA. STAR makes high-quality crash data available, such as exact locations and verified numbers of fatalities. Each audience gets the information it needs: BLIQ for elected officials, a public crash map for residents and associations, and VIA Software for professionals.
BLIQ is published three times a year: preliminary figures at the start of the year, final figures in April and half-year figures in September. Every municipality, region, province, water authority and police unit can download it free of charge and share it. In 2025, 431 tailored editions were produced, accounting for 839 downloads.
Public documents on Dutch government websites show that BLIQ is used at every stage of a risk-based road safety program:
- analyzing network risks;
- setting priorities;
- informing elected officials and reporting back to them;
- selecting countermeasures for specific locations;
- coordinating enforcement.
It started with a question from practice
BLIQ was developed in 2016 together with the Eindhoven Metropolitan Region. Its cities wanted to inform their council members regularly, with one standard report for every city and a shared benchmark: traffic injuries and fatalities per 10,000 residents.
Their wishes were concrete. The trend had to be visible at a glance, including its direction based on the latest data. Cities wanted to show their own policy emphases, such as people biking or young road users. Council members had to be able to ask targeted questions without running analyses themselves.
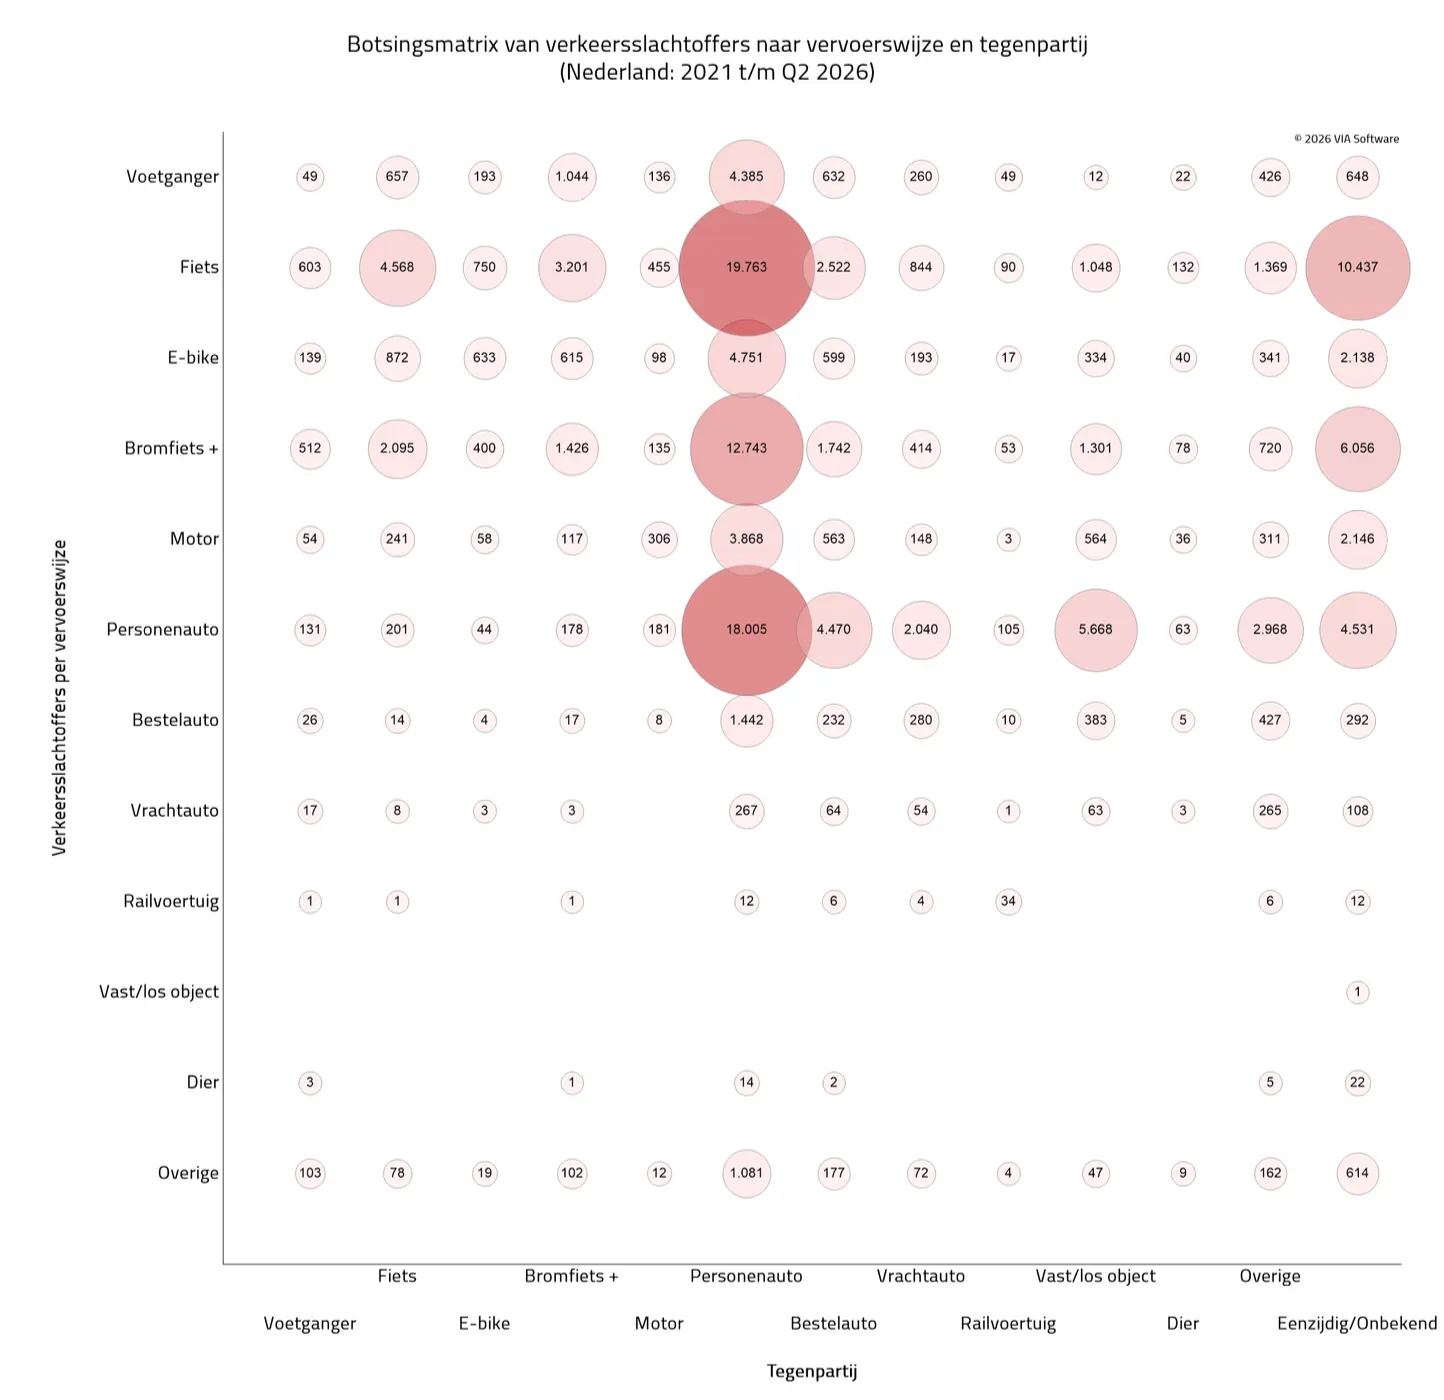
Over ten years, BLIQ kept developing. The top 10 of unsafe roadway segments and intersections was added when CROSS became available. The effect of COVID-19 on the 2020 and 2021 figures was made visible. Most recently, the collision matrix was added: traffic injuries and fatalities by mode of travel and the other party involved.
What other agencies can take from it
The Dutch experience points to five lessons for any agency working with the Safe System Approach:
- One report, one benchmark. When every agency receives the same report with the same definitions, figures become comparable and discussions start from the same facts.
- A fixed rhythm. Three editions a year keep road safety on the agenda of elected officials, not only after a fatal crash.
- The right information for each audience. Elected officials need a clear trend and priorities, engineers need detail, residents need a map.
- Speeds next to crashes. Combining crash records with speed data shows risk on roads where the crash record is still thin.
- Built with users. BLIQ was designed with the people who use it. VIA still works this way, for example on Data-driven working with the city of The Hague and an evaluation tool for mobile speed cameras with the province of Groningen.
BLIQ in California
BLIQ is also available for cities, counties and law enforcement agencies in California. Read more on the BLIQ product page.
Have an idea?
Do you have an idea that would make your work easier or better, and do you know that colleagues at other agencies face the same question? We would like to hear from you.
We prefer to work with a small but diverse group of users, so we get a clear view of what the product needs to do. VIA then assesses the technical and data feasibility. If that works out, we develop a concept. With the feedback from user testing, we work together toward a final product.
There is no charge for this cooperation: what we build becomes part of the platform, and updates are always included in the price (see our pricing). We do ask for the commitment and involvement of the participating users.
Get in touch at info@via.nl. Who knows, in ten years your idea may be in the spotlight too.