Every road safety program has to answer the same question: where do we act first?
The budget is limited, the network is large and every location has its advocates. A ranked project list is the answer to that question. But a list is only as strong as the screening behind it. If it rests on incomplete data or on locations that happened to be in the news, it will not hold up in front of elected officials, residents or a funding program.
Why the list matters now
In California, the list has a direct link to funding. A local agency that applies for Highway Safety Improvement Program (HSIP) funds needs a Local Roadway Safety Plan (LRSP) or an accepted equivalent, such as a Systemic Safety Analysis Report, a Vision Zero Action Plan or a comprehensive safety action plan funded through Safe Streets and Roads for All (SS4A). That plan has to be updated at least every five years.
Each of these plans rests on the same foundation: a data-driven picture of where people are killed and seriously injured, and a justified order in which to address it.
Step 1: start with all crashes
Screening begins with the full set of crash records, not just the ones that are easy to use.
That is less obvious than it sounds. In the 2025 records of the California Crash Reporting System (CCRS), more than a fifth of crashes come without coordinates. They do carry the street names and the city, so they can be located. Leaving them out is not a neutral choice: those records hold around 15 percent of all fatal crashes. A screening that skips them systematically underestimates some locations.
Step 2: put every crash on the network
A crash only becomes useful for prioritization when it is tied to a place an agency manages: an intersection, a roadway segment, a city or county. Only then can locations be compared, and only then does each agency see its own part of the picture.
Step 3: screen the whole network
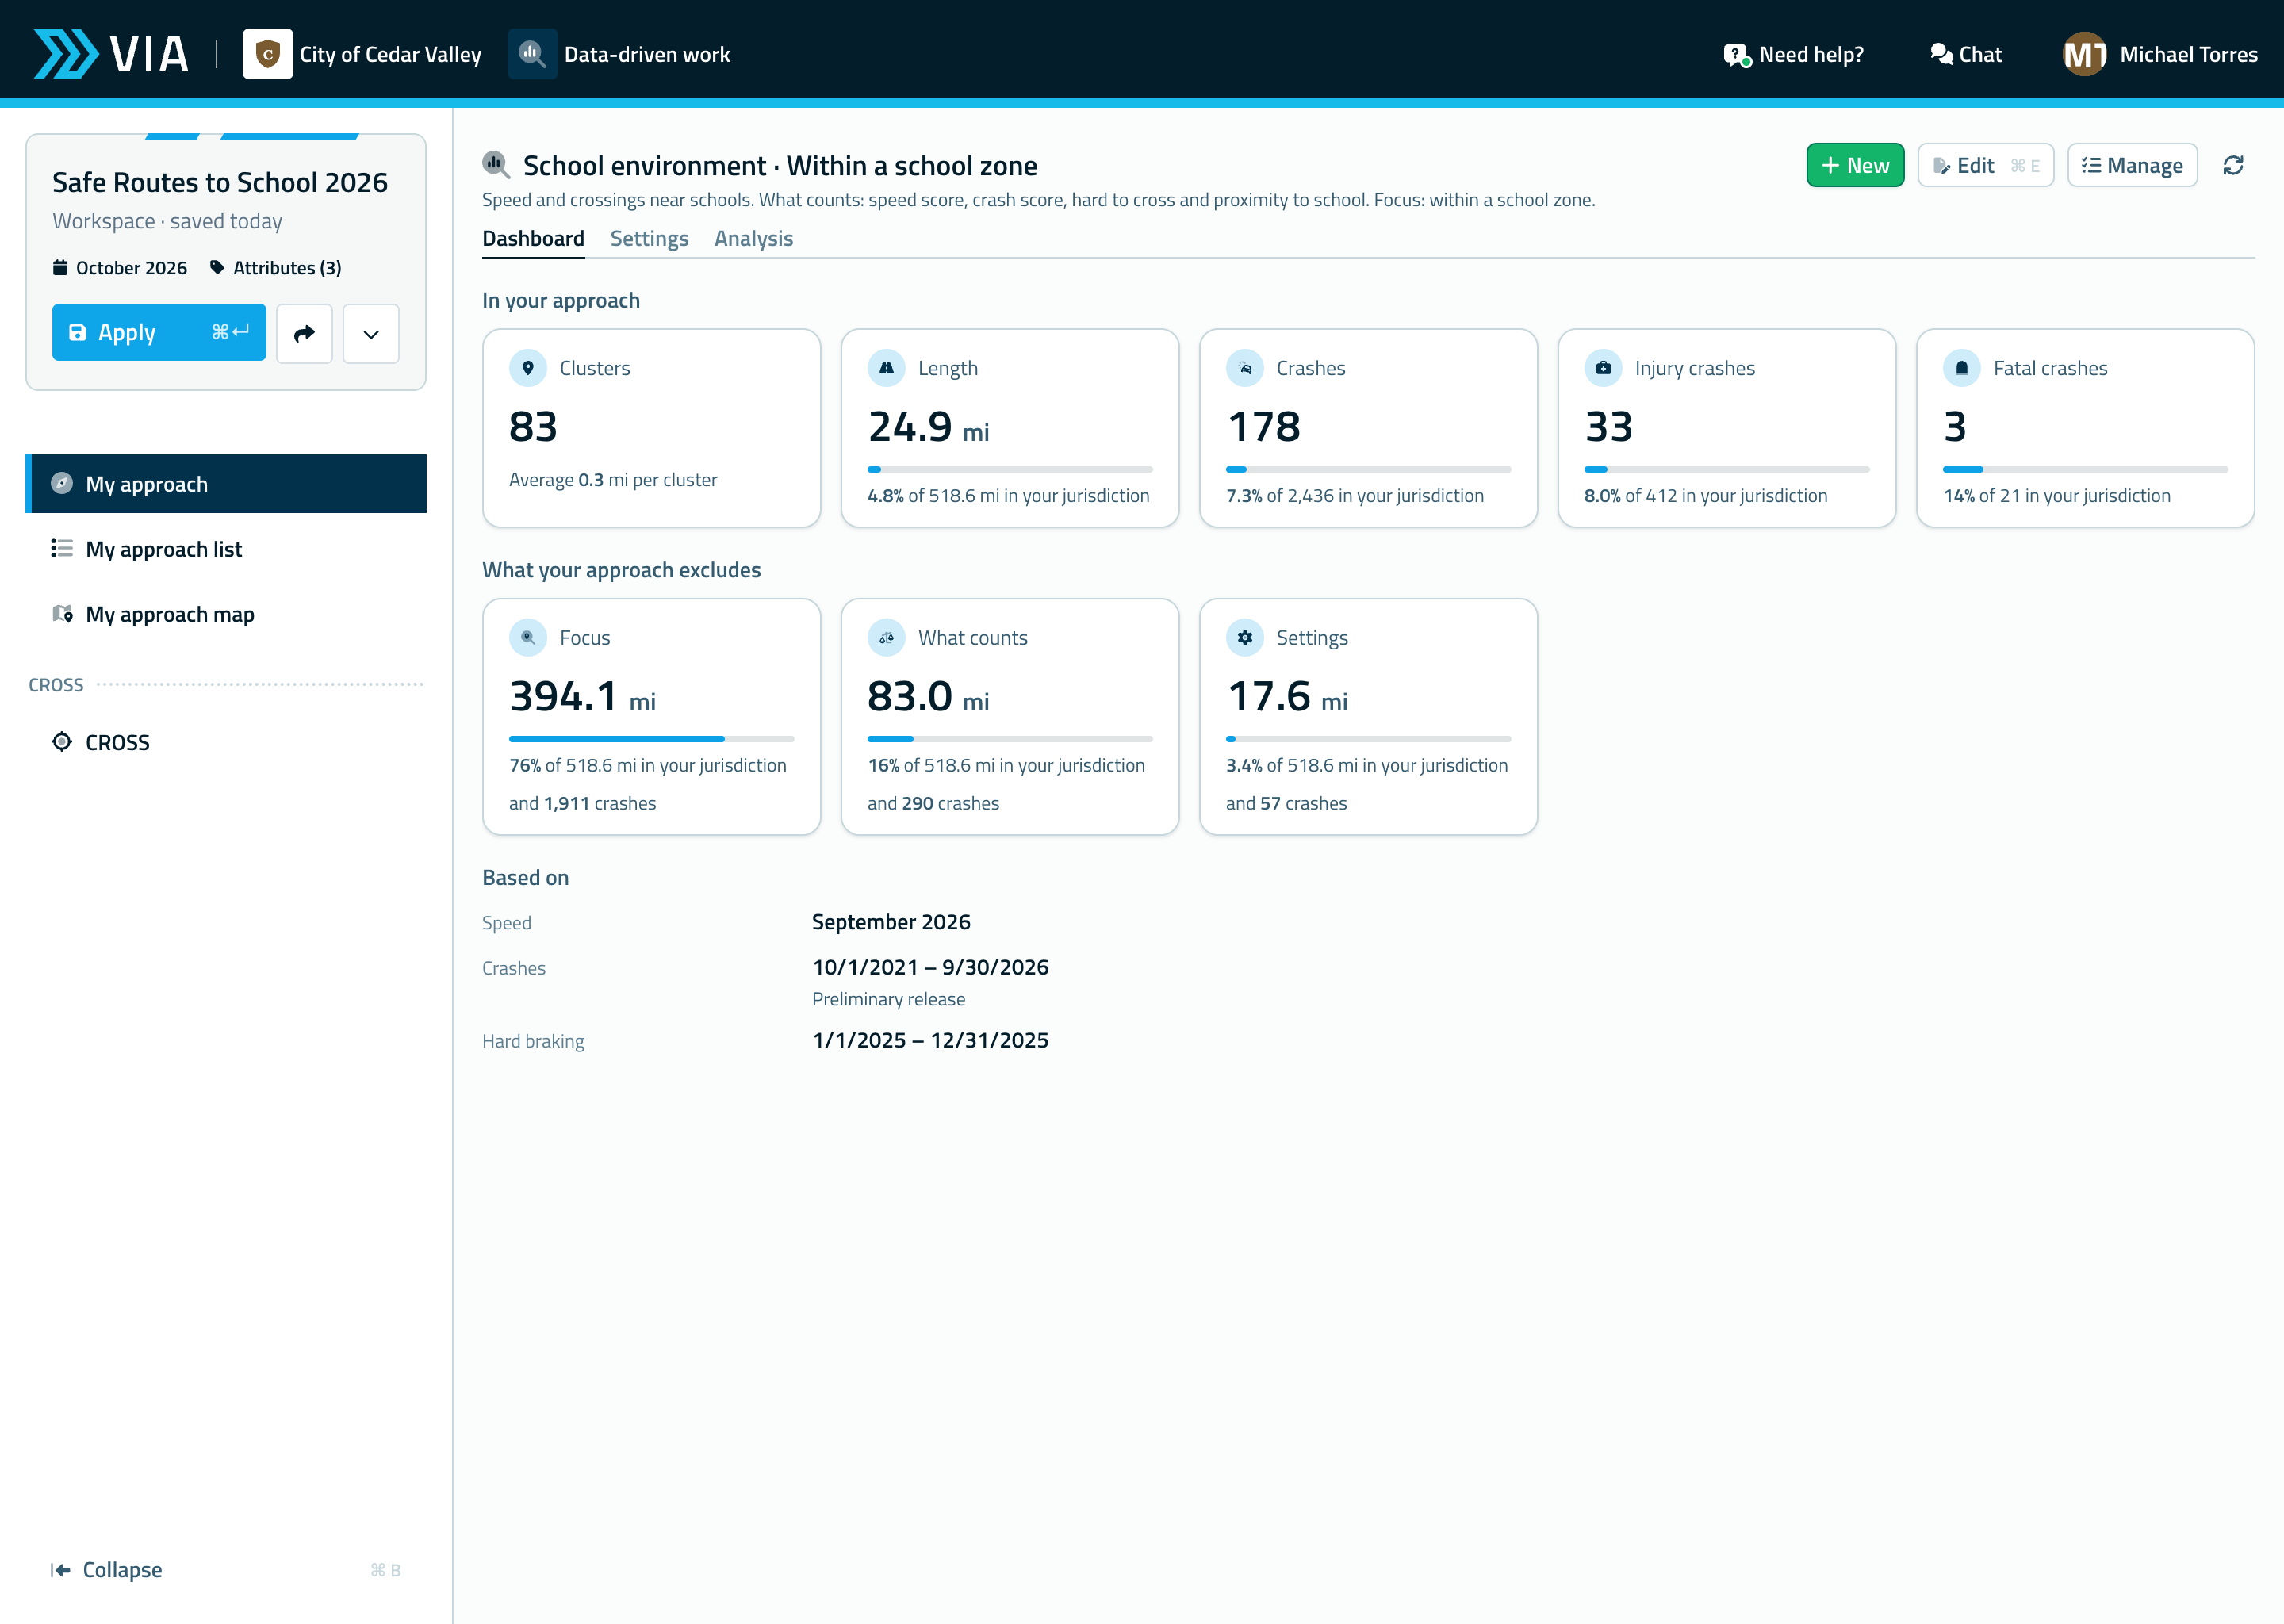
With the crashes on the network, the whole network can be screened at once rather than location by location. Which intersections and segments see the most crashes, and above all the most people killed or seriously injured? Which locations stand out year after year, and which only once?
Weighting by severity matters. A location with many minor rear-end crashes asks for a different countermeasure than a location with fewer crashes but more serious injuries among people walking or biking.
Step 4: explain why a location ranks high
A ranking alone invites the question: why here?
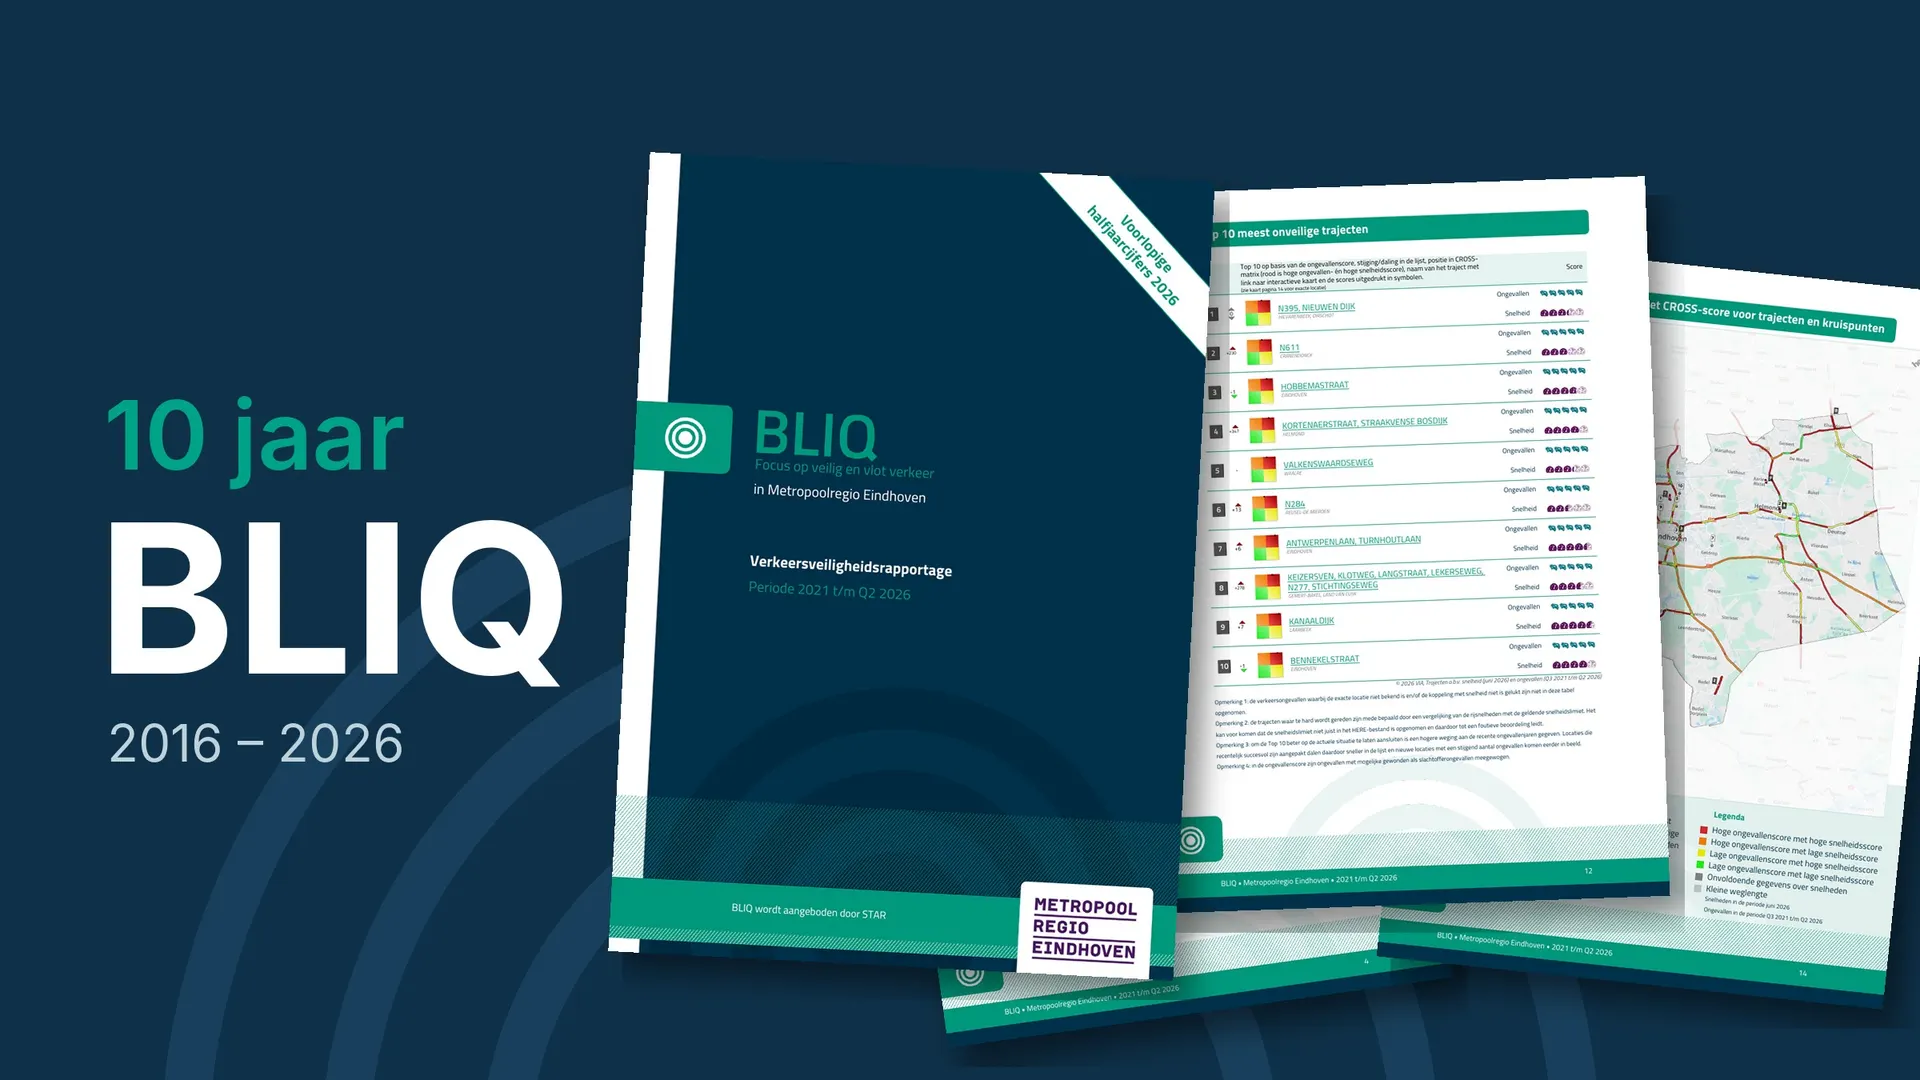
This is where combining sources helps. By crossing a location’s crash score with its speed score, the CROSS method shows whether a high ranking comes with structurally high speeds. That points toward the cause, and therefore toward the countermeasure. A location that ranks high on both is a different case from one that ranks high on crashes alone.
Step 5: decide, document and evaluate
The result is a list an agency can explain: which locations, in which order and on what basis. Documenting the choices makes the plan reproducible when it has to be updated, and makes the next funding application easier to support.
And after the countermeasure, the same data shows whether it worked. A before/after comparison of crashes and actual speeds closes the loop the Safe System Approach asks for.
From data to decisions
None of these steps is new. What has changed is that they no longer require a dedicated analysis project. When crash records and speed data are already combined and placed on the network, an agency can spend its time on the decisions themselves.
Giedo Donkers presents this approach in session TS2.2 at R2T in Santa Clara.